

We will continue working with the function from problem 1. Now we will make two wave packages in time, with two different frequency components. We
We will continue working with the function from problem 1. Now we will make two wave packages in time, with two different frequency components. We do this by using Gaussian wrapping functions. The function to be implemented is
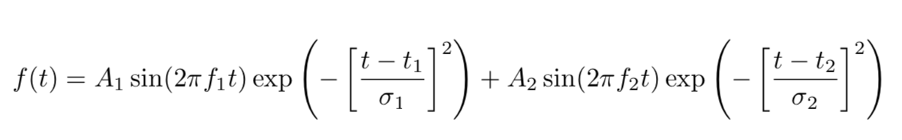
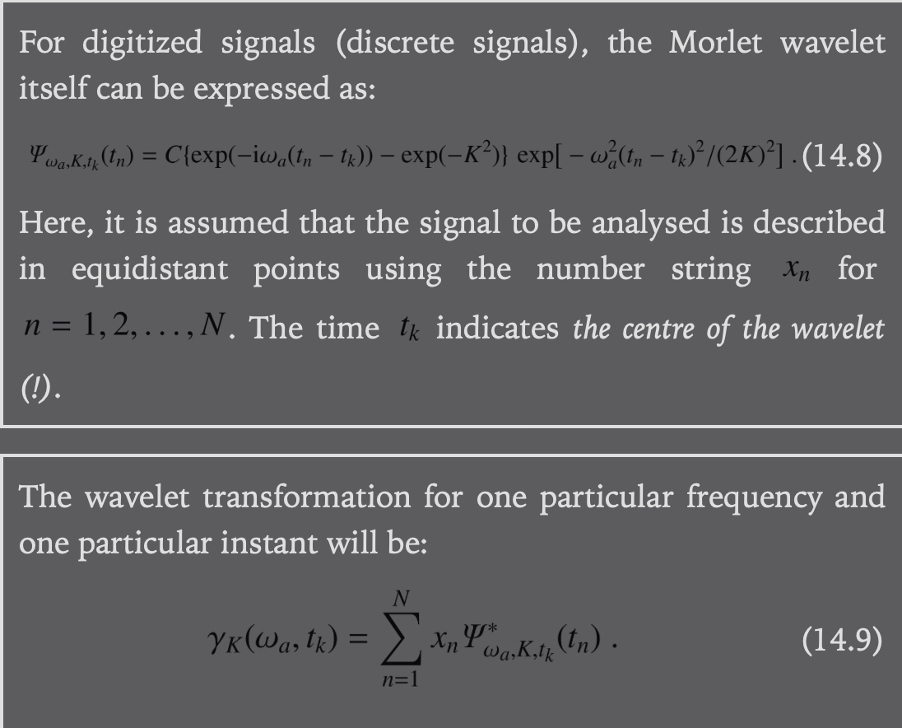
medA1 = 1.0mogA2 = 1.7m, f1 = 100Hzogf2 = 160Hz, t1 = 0.20s, t2 = 0.60s, 1 = 0.05sog2 = 0.10s, fs = 1 kHz. Let the sampling time be T = 1 s. a) Plot the sampled time series. Plot saw its discrete Fourier transform. b) Write a program that calculates the wavelet transform using Morlet wavelets in the time domain. Suggested procedure: Create a wavelet function that implements Boka Eq. (14.8), a wavelet transform feature that implements Boka Eq. (14.9) for a given analysis frequency a, and which calls the wavelet, and, a function wavelet diagram that uses the wavelet transform to calculate the wavelet transform for several analysis frequencies. The result will be a 2-dimensional wavelet diagram with amplitude as a function of time and analysis frequency. You get points for writing an almost correct program, even if you do not get the correct answer from it, you then have to explain well what the different parts of the program should do. Tip: An np array for complex numbers can be created e.g. such as: gamma = np.zeros (N, dtype = np.complex). c) Calculate the wavelet transform of the signal above. Let the analysis frequency go from 80 to 200 Hz, with 100 analysis frequencies in total, logarithmically distributed (something as usual in wavelet transformation). Plot in turn the result for the wave number K equal to 6 and 60 (feel free to test several values). Comment on the result. Tip: On my 2013 laptop it takes approx. 60 then run the analysis for the two wavelet diagrams. It may therefore be wise to reduce T to e.g. 0.1 s while debugging. Then it only takes 2 seconds (how does the time use scale?). Then take T back 1 s for the final plots.
book equations -
Step by Step Solution
There are 3 Steps involved in it
Step: 1

See step-by-step solutions with expert insights and AI powered tools for academic success
Step: 2

Step: 3
Ace Your Homework with AI
Get the answers you need in no time with our AI-driven, step-by-step assistance
Get Started
Authors: Ted Dunning, Ellen Friedman
1st Edition
1491914726, 978-1491914724