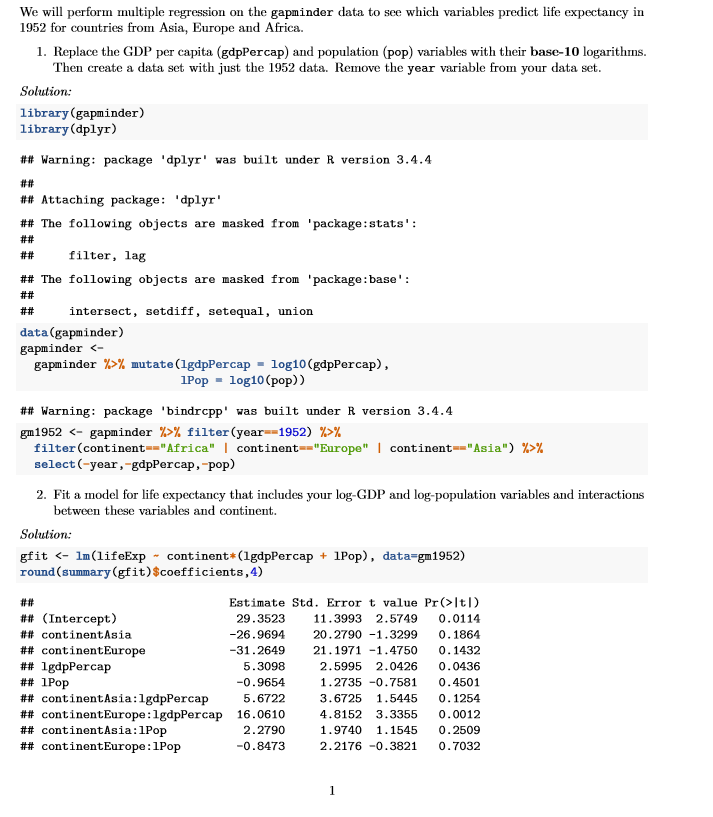
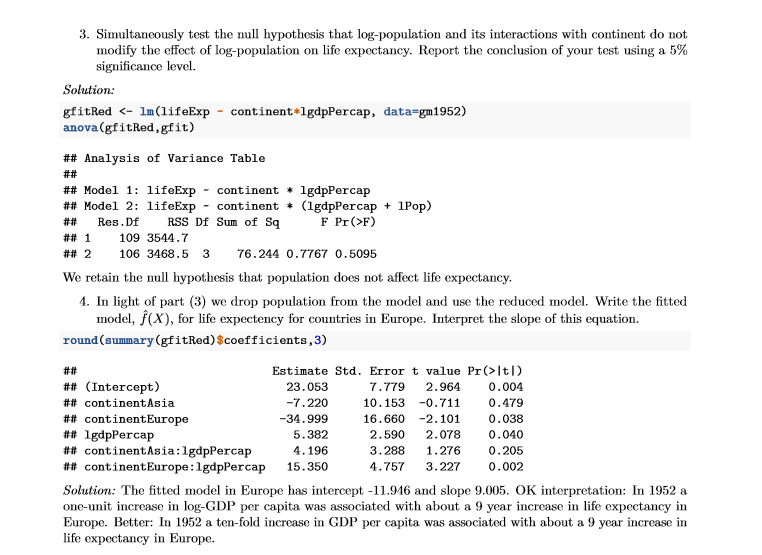
We will perform multiple regression on the gapminder data to see which variables predict life expectancy in 1952 for countries from Asia, Europe and Africa. 1. Replace the GDP per capita (gapPercap) and population (pop) variables with their base-10 logarithms. Then create a data set with just the 1952 data. Remove the year variable from your data set. Solution: library (gapminder) library (dplyr) ## Warning: package 'dplyr' was built under R version 3.4.4 ## Attaching package: 'dplyr' ## The following objects are masked from 'package:stats': # # ## filter, lag ## The following objects are masked from 'package: base' : # # intersect, setdiff, setequal, union data (gapminder) gapminder gapminder %>% mutate (1gdpPercap = log10(gapPercap), 1Pop - log10 (pop)) ## Warning: package 'bindropp' was built under R version 3.4.4 gm1952 % filter (year -1952) %>% filter (continent ="Africa" | continent ="Europe" | continent ="Asia") %>% select (-year, -gapPercap, -pop) 2. Fit a model for life expectancy that includes your log-GDP and log-population variables and interactions between these variables and continent. Solution: gfit Itl) ## (Intercept) 29.3523 11. 3993 2.5749 0. 0114 ## continentAsia -26.9694 20.2790 -1.3299 0. 1864 ## continentEurope -31.2649 21. 1971 -1.4750 0. 1432 ## 1gapPercap 5.3098 2. 5995 2.0426 0. 0436 ## 1Pop -0.9654 1.2735 -0.7581 0. 4501 ## continentAsia : 1gapPercap 5.6722 3. 6725 1.5445 0. 1254 ## continentEurope : 1gapPercap 16. 0610 4. 8152 3.3355 0. 0012 ## continentAsia:1Pop 2.2790 1.9740 1. 1545 0. 2509 ## continentEurope: 1Pop -0.8473 2.2176 -0.3821 0.70323. Simultaneously test the null hypothesis that log-population and its interactions with continent do not modify the effect of log-population on life expectancy. Report the conclusion of your test using a 5% significance level. Solution: gfitRed F) ff# 1 109 3544.7 ff# 2 106 3468.5 3 76.244 0.7767 0.5095 We retain the null hypothesis that population does not affect life expectancy. 4. In light of part (3) we drop population from the model and use the reduced model. Write the fitted model, f(X), for life expectency for countries in Europe. Interpret the slope of this equation. round (summary (gfitRed) $coefficients,3) Estimate Std. Error t value Pr(>Itl) ## (Intercept) 23. 053 7.779 2.964 0. 004 f# continentAsia -7.220 10. 153 -0.711 0.479 ## continentEurope -34.999 16.660 -2. 101 0.038 ## 1gapPercap 5.382 2.590 2.078 0.040 ## continentAsia: 1gapPercap 4.196 3.288 1.276 0.205 ## continentEurope : 1gapPercap 15.350 4.757 3.227 0.002 Solution: The fitted model in Europe has intercept -11.946 and slope 9.005. OK interpretation: In 1952 a one-unit increase in log-GDP per capita was associated with about a 9 year increase in life expectancy in Europe. Better: In 1952 a ten-fold increase in GDP per capita was associated with about a 9 year increase in life expectancy in Europe