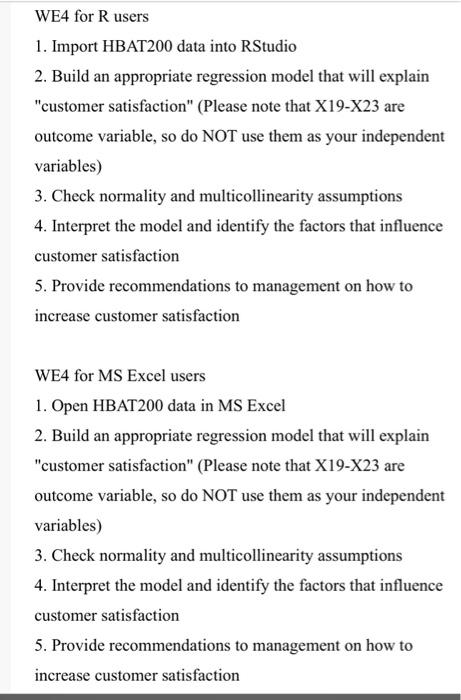
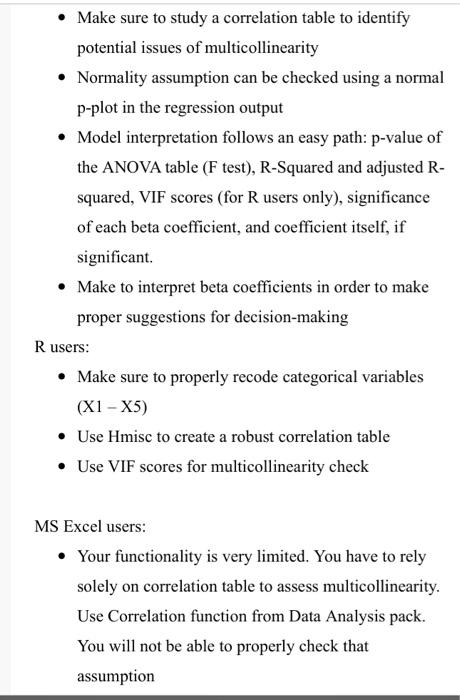
WE4 for R users 1. Import HBAT200 data into RStudio 2. Build an appropriate regression model that will explain "customer satisfaction" (Please note that X19-X23 are outcome variable, so do NOT use them as your independent variables) 3. Check normality and multicollinearity assumptions 4. Interpret the model and identify the factors that influence customer satisfaction 5. Provide recommendations to management on how to increase customer satisfaction WE4 for MS Excel users 1. Open HBAT200 data in MS Excel 2. Build an appropriate regression model that will explain "customer satisfaction" (Please note that X19-X23 are outcome variable, so do NOT use them as your independent variables) 3. Check normality and multicollinearity assumptions 4. Interpret the model and identify the factors that influence customer satisfaction 5. Provide recommendations to management on how to increase customer satisfaction - Make sure to study a correlation table to identify potential issues of multicollinearity - Normality assumption can be checked using a normal p-plot in the regression output - Model interpretation follows an easy path: p-value of the ANOVA table (F test), R-Squared and adjusted Rsquared, VIF scores (for R users only), significance of each beta coefficient, and coefficient itself, if significant. - Make to interpret beta coefficients in order to make proper suggestions for decision-making R users: - Make sure to properly recode categorical variables (X1 - X5) - Use Hmisc to create a robust correlation table - Use VIF scores for multicollinearity check MS Excel users: - Your functionality is very limited. You have to rely solely on correlation table to assess multicollinearity. Use Correlation function from Data Analysis pack. You will not be able to properly check that assumption WE4 for R users 1. Import HBAT200 data into RStudio 2. Build an appropriate regression model that will explain "customer satisfaction" (Please note that X19-X23 are outcome variable, so do NOT use them as your independent variables) 3. Check normality and multicollinearity assumptions 4. Interpret the model and identify the factors that influence customer satisfaction 5. Provide recommendations to management on how to increase customer satisfaction WE4 for MS Excel users 1. Open HBAT200 data in MS Excel 2. Build an appropriate regression model that will explain "customer satisfaction" (Please note that X19-X23 are outcome variable, so do NOT use them as your independent variables) 3. Check normality and multicollinearity assumptions 4. Interpret the model and identify the factors that influence customer satisfaction 5. Provide recommendations to management on how to increase customer satisfaction - Make sure to study a correlation table to identify potential issues of multicollinearity - Normality assumption can be checked using a normal p-plot in the regression output - Model interpretation follows an easy path: p-value of the ANOVA table (F test), R-Squared and adjusted Rsquared, VIF scores (for R users only), significance of each beta coefficient, and coefficient itself, if significant. - Make to interpret beta coefficients in order to make proper suggestions for decision-making R users: - Make sure to properly recode categorical variables (X1 - X5) - Use Hmisc to create a robust correlation table - Use VIF scores for multicollinearity check MS Excel users: - Your functionality is very limited. You have to rely solely on correlation table to assess multicollinearity. Use Correlation function from Data Analysis pack. You will not be able to properly check that assumption


