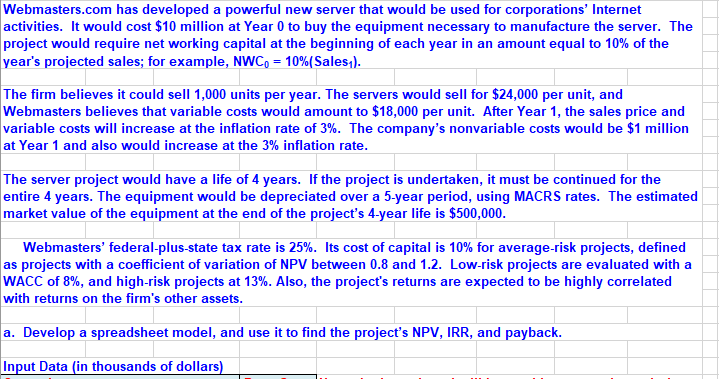
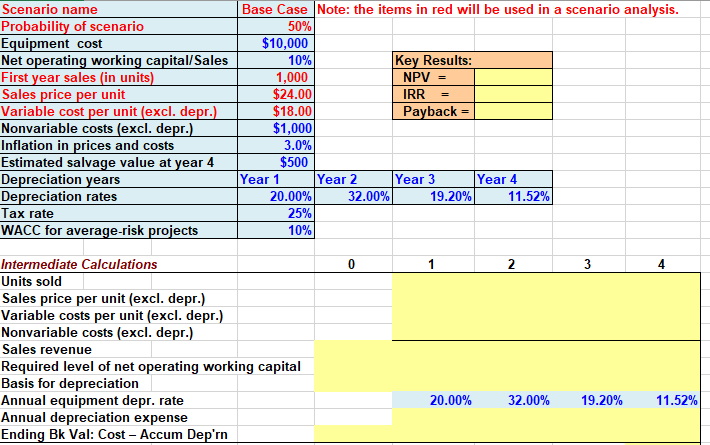
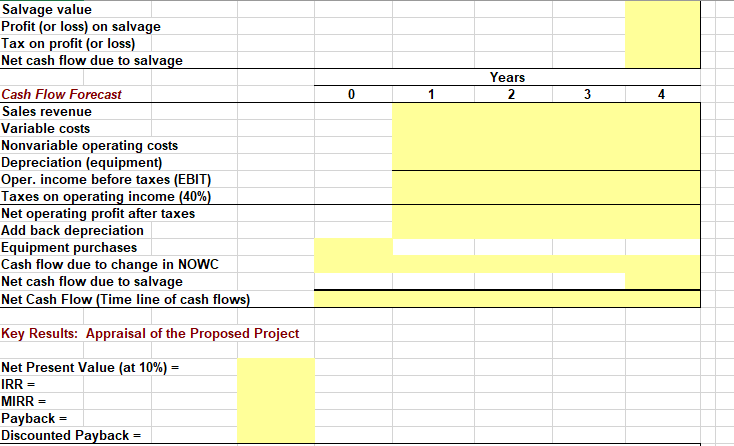
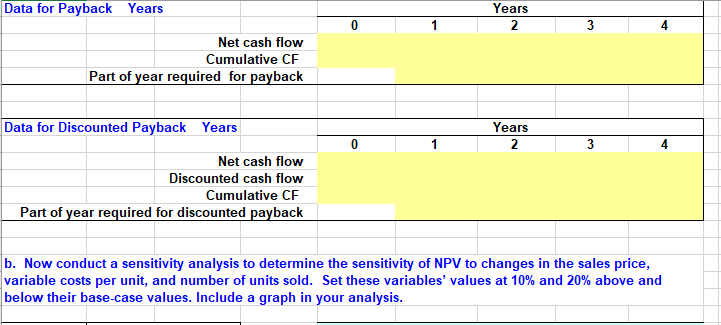
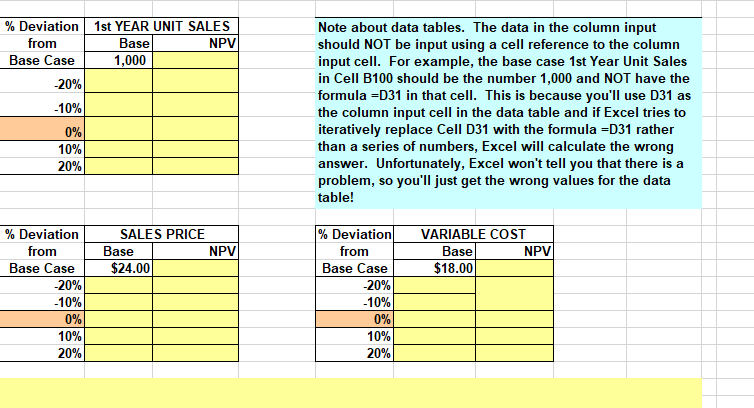
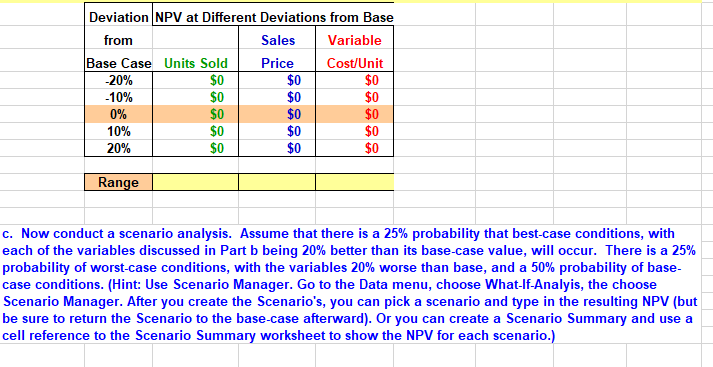
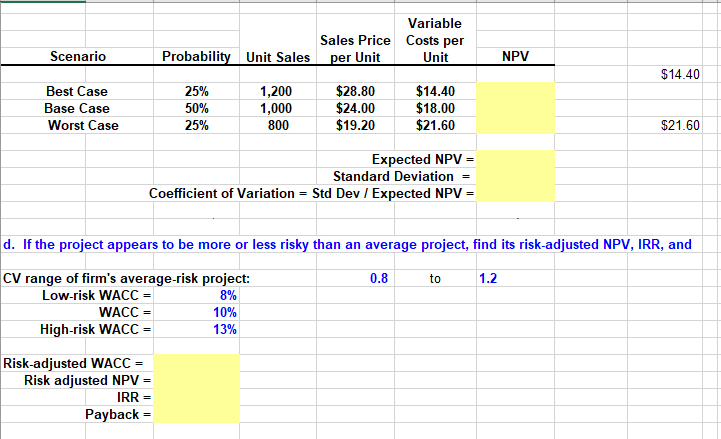
Webmasters.com has developed a powerful new server that would be used for corporations' Internet activities. It would cost $10 million at Year 0 to buy the equipment necessary to manufacture the server. The project would require net working capital at the beginning of each year in an amount equal to 10% of the year's projected sales; for example, NWC0=10%( Sales 1). The firm believes it could sell 1,000 units per year. The servers would sell for $24,000 per unit, and Webmasters believes that variable costs would amount to $18,000 per unit. After Year 1 , the sales price and variable costs will increase at the inflation rate of 3%. The company's nonvariable costs would be $1 million at Year 1 and also would increase at the 3% inflation rate. The server project would have a life of 4 years. If the project is undertaken, it must be continued for the entire 4 years. The equipment would be depreciated over a 5-year period, using MACRS rates. The estimated market value of the equipment at the end of the project's 4-year life is $500,000. Webmasters' federal-plus-state tax rate is 25%. Its cost of capital is 10% for average-risk projects, defined as projects with a coefficient of variation of NPV between 0.8 and 1.2. Low-risk projects are evaluated with a WACC of 8%, and high-risk projects at 13%. Also, the project's returns are expected to be highly correlated with returns on the firm's other assets. a. Develop a spreadsheet model, and use it to find the project's NPV, IRR, and payback. Input Data (in thousands of dollars) Salvage value Profit (or loss) on salvage Tax on profit (or loss) Net cash flow due to salvage Cash Flow Forecast Sales revenue Variable costs Nonvariable operating costs Depreciation (equipment) Oper. income before taxes (EBIT) Taxes on operating income (40%) Net operating profit after taxes Add back depreciation Equipment purchases Cash flow due to change in NOWC Net cash flow due to salvage Net Cash Flow (Time line of cash flows) Key Results: Appraisal of the Proposed Project Net Present Value (at 10\%) = IRR= MIRR= Payback = Discounted Payback = Data for Payback Years Years Net cash flow Cumulative CF Part of year required for payback b. Now conduct a sensitivity analysis to determine the sensitivity of NPV to changes in the sales price, variable costs per unit, and number of units sold. Set these variables' values at 10% and 20% above and below their base-case values. Include a graph in your analysis. Note about data tables. The data in the column input should NOT be input using a cell reference to the column input cell. For example, the base case 1st Year Unit Sales in Cell B100 should be the number 1,000 and NOT have the formula=D31 in that cell. This is because you'll use D31 as the column input cell in the data table and if Excel tries to iteratively replace Cell D31 with the formula = D31 rather than a series of numbers, Excel will calculate the wrong answer. Unfortunately, Excel won't tell you that there is a problem, so you'll just get the wrong values for the data table! c. Now conduct a scenario analysis. Assume that there is a 25% probability that best-case conditions, with each of the variables discussed in Part b being 20% better than its base-case value, will occur. There is a 25% probability of worst-case conditions, with the variables 20% worse than base, and a 50% probability of basecase conditions. (Hint: Use Scenario Manager. Go to the Data menu, choose What-If-Analyis, the choose Scenario Manager. After you create the Scenario's, you can pick a scenario and type in the resulting NPV (but be sure to return the Scenario to the base-case afterward). Or you can create a Scenario Summary and use a cell reference to the Scenario Summary worksheet to show the NPV for each scenario.) d. If the project appears to be more or less risky than an average project, find its risk-adjusted NPV, IRR, and \begin{tabular}{|r|r|r|r|} \hline CV range of firm's average-risk project: & 0.8 & to & 1.2 \\ \hline Low-risk WACC = & 8% & & \\ \hline WACC = & 10% \\ \hline High-risk WACC = & 13% & & \\ \hline \end{tabular} Risk-adjusted WACC = Risk adjusted NPV = IRR=Payback= On the basis of information in the problem, would you recommend that the project be accepted