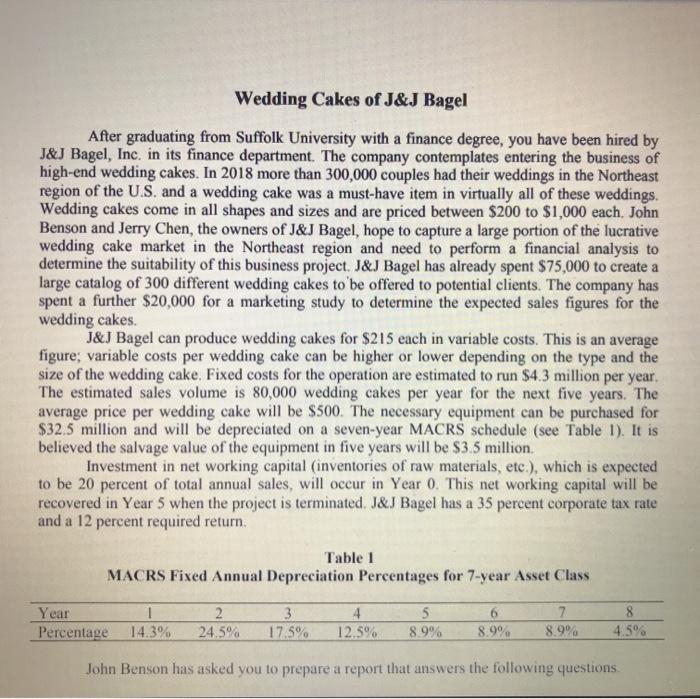
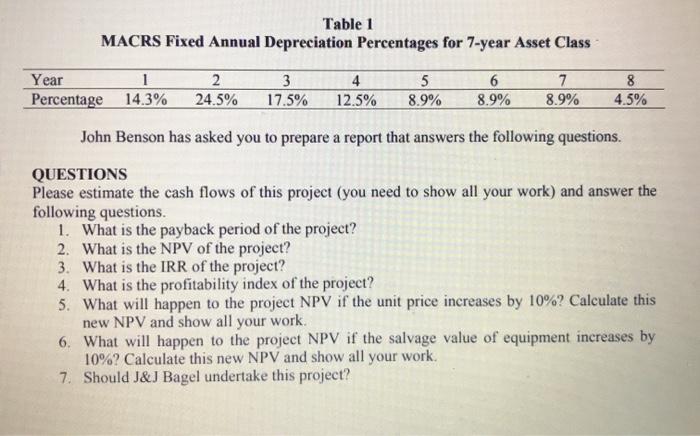
Wedding Cakes of J&J Bagel After graduating from Suffolk University with a finance degree, you have been hired by J&J Bagel, Inc. in its finance department. The company contemplates entering the business of high-end wedding cakes. In 2018 more than 300,000 couples had their weddings in the Northeast region of the U.S. and a wedding cake was a must-have item in virtually all of these weddings. Wedding cakes come in all shapes and sizes and are priced between $200 to $1,000 each, John Benson and Jerry Chen, the owners of J&J Bagel, hope to capture a large portion of the lucrative wedding cake market in the Northeast region and need to perform a financial analysis to determine the suitability of this business project . J&J Bagel has already spent $75,000 to create a large catalog of 300 different wedding cakes to be offered to potential clients. The company has spent a further $20,000 for a marketing study to determine the expected sales figures for the wedding cakes. J&J Bagel can produce wedding cakes for $215 each in variable costs. This is an average figure; variable costs per wedding cake can be higher or lower depending on the type and the size of the wedding cake. Fixed costs for the operation are estimated to run $4.3 million per year. The estimated sales volume is 80,000 wedding cakes per year for the next five years. The average price per wedding cake will be $500. The necessary equipment can be purchased for $32.5 million and will be depreciated on a seven-year MACRS schedule (see Table 1). It is believed the salvage value of the equipment in five years will be $3.5 million Investment in net working capital (inventories of raw materials, etc.), which is expected to be 20 percent of total annual sales, will occur in Year 0. This net working capital will be recovered in Year 5 when the project is terminated. J&J Bagel has a 35 percent corporate tax rate and a 12 percent required return. Table 1 MACRS Fixed Annual Depreciation Percentages for 7-year Asset Class Year Percentage 1 14.3% 2 24.5% 3 17.5% 4 12.5% 5 8.9% 6 8.9% 7 8.9% 8 4.5% John Benson has asked you to prepare a report that answers the following questions Table 1 MACRS Fixed Annual Depreciation Percentages for 7-year Asset Class Year 1 Percentage 14.3% 2 24.5% 3 17.5% 4 12.5% 5 8.9% 6 8.9% 7 8.9% 8 4.5% John Benson has asked you to prepare a report that answers the following questions. QUESTIONS Please estimate the cash flows of this project (you need to show all your work) and answer the following questions. 1. What is the payback period of the project? 2. What is the NPV of the project? 3. What is the IRR of the project? 4. What is the profitability index of the project? 5. What will happen to the project NPV if the unit price increases by 10%? Calculate this new NPV and show all your work. 6. What will happen to the project NPV if the salvage value of equipment increases by 10%? Calculate this new NPV and show all your work 7. Should J&J Bagel undertake this project


