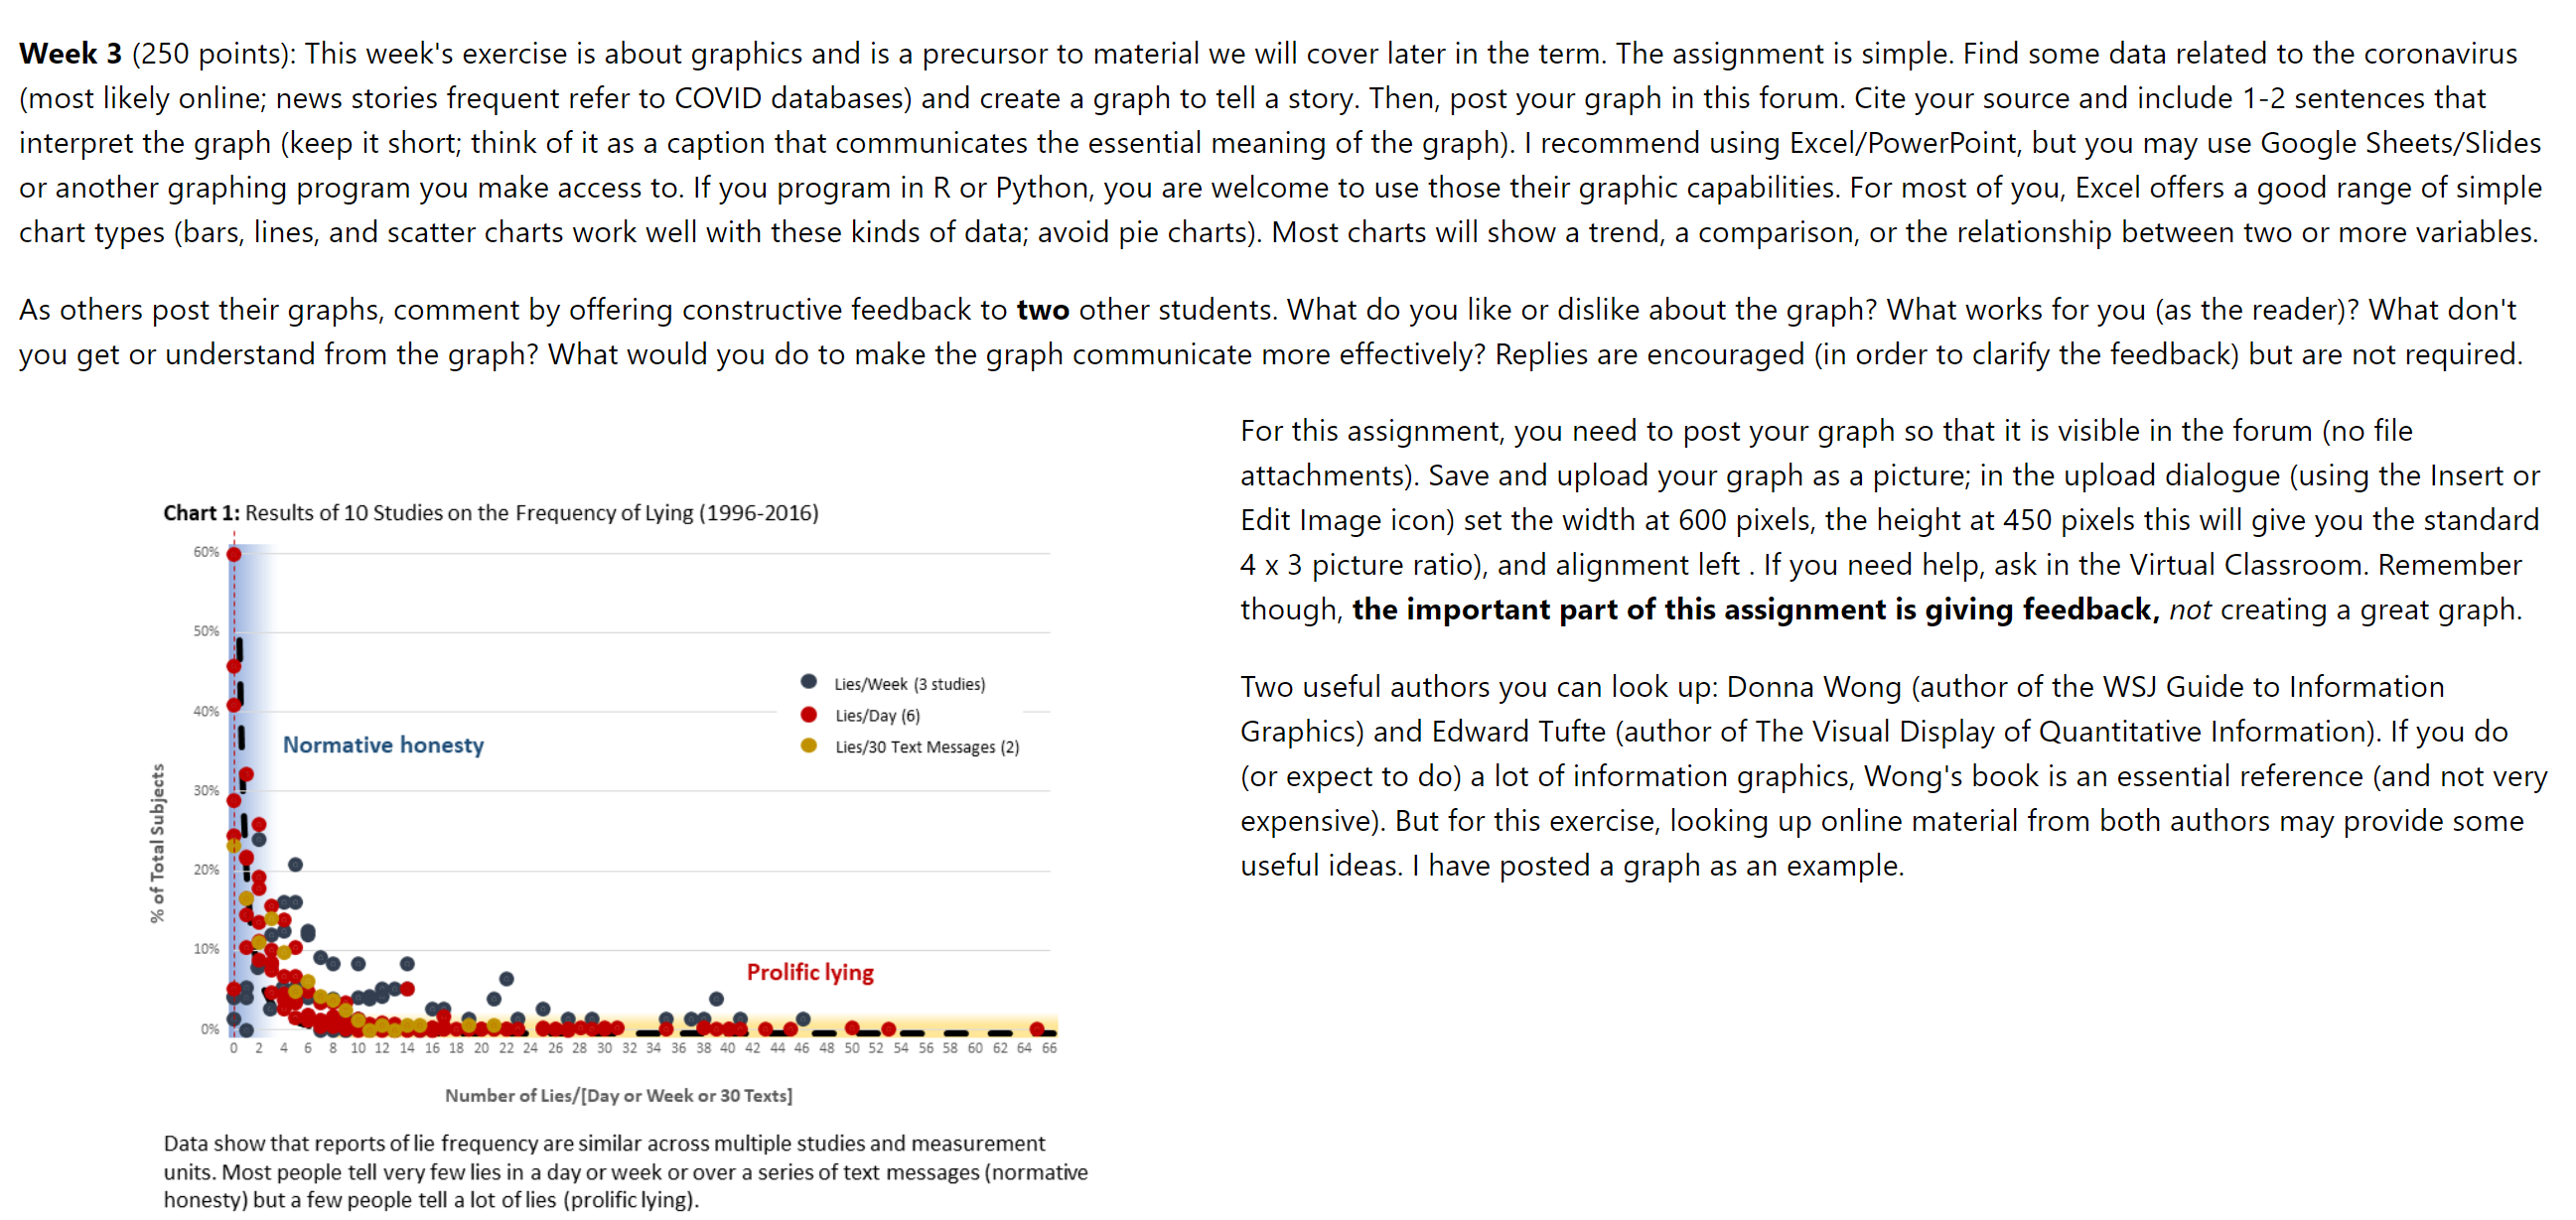
Week 3 (250 points): This week's exercise is about graphics and is a precursor to material we will cover later in the term. The assignment is simple. Find some data related to the coronavirus (most likely online; news stories frequent refer to COVID databases) and create a graph to tell a story. Then, post your graph in this forum Cite your source and include 12 sentences that interpret the graph (keep it short; think of it as a caption that communicates the essential meaning of the graph). | recommend using Excel/PowerPoint, but you may use Google Sheets/Slides or another graphing program you make access to. If you program in R or Python, you are welcome to use those their graphic capabilities. For most of you, Excel offers a good range of simple chart types (bars, lines, and scatter charts work well with these kinds of data; avoid pie charts). Most charts will show a trend, a comparison, or the relationship between two or more variables. As others post their graphs, comment by offering constructive feedback to two other students. What do you like or dislike about the graph? What works for you (as the reader)? What don't you get or understand from the graph? What would you do to make the graph communicate more effectively? Replies are encouraged (in order to clarify the feedback) but are not required. For this assignment, you need to post your graph so that it is visible in the forum (no file attachments). Save and upload your graph as a picture; in the upload dialogue (using the Insert or Chm\"?\"BSUl'Wosmdlesmthe "equemw-Ving(19992015) Edit Image icon) set the width at 600 pixels, the height at 450 pixels this will give you the standard W 4 x 3 picture ratio), and alignment left . If you need help, ask in the Virtual Classroom. Remember 50% though, the important part of this assignment is giving feedback, not creating a great graph. 0 lies/Weekmdiesl Two useful authors you can look up: Donna Wong (author of the WSJ Guide to Information \"7" O lies/DING) Graphics) and Edward Tufte (author of The Visual Display Of Quantitative Information). If you do (or expect to do) a lot of information graphics, Wong's book is an essential reference (and not very expensive). But for this exercise, looking up online material from both authors may provide some useful ideas. l have posted a graph as an example. Normative honesty O hes/30 rm Messages (2) 56 u! Tor-l Subjects Prolic lying O \"Jud_e.o_ _ _ .. u z A s Emu14islzznzzuzszss323Aassswdzuasuwszsasssawsxmss Numrm M Lies/[Day or Week or 30 run] Data show that reports of lie frequency are similar across multiple studies and measurement units. Most people tell very few lies in a day or week or over a series of text messages (normative honesty) but a few people tell a lot of lies (proliclving)