

Answered step by step
Verified Expert Solution
Question
1 Approved Answer
Week 8 - Stocks, Chapter 1 0 Your work must be computer typed. Handwritten work will not be accepted. Your answer must show work! Exercise
Week Stocks, Chapter
Your work must be computer typed. Handwritten work will not be accepted. Your answer must show work!
Exercise
A fund had the following annual prices and dividends beginning of the year:
table$$
Price reflects a two for one split.
a Compute each year return.
b Compute the five years holding period return.
c Compute the annualized rate of return
The Millennium Falcon Company Inc. had the following six years returns: and Compute MFs stock average return, variance and standard deviation.
At the same years the market index performance was and Calculate the index average return, standard deviation and the Millennium Falcon a covariance and correlation with the market index.
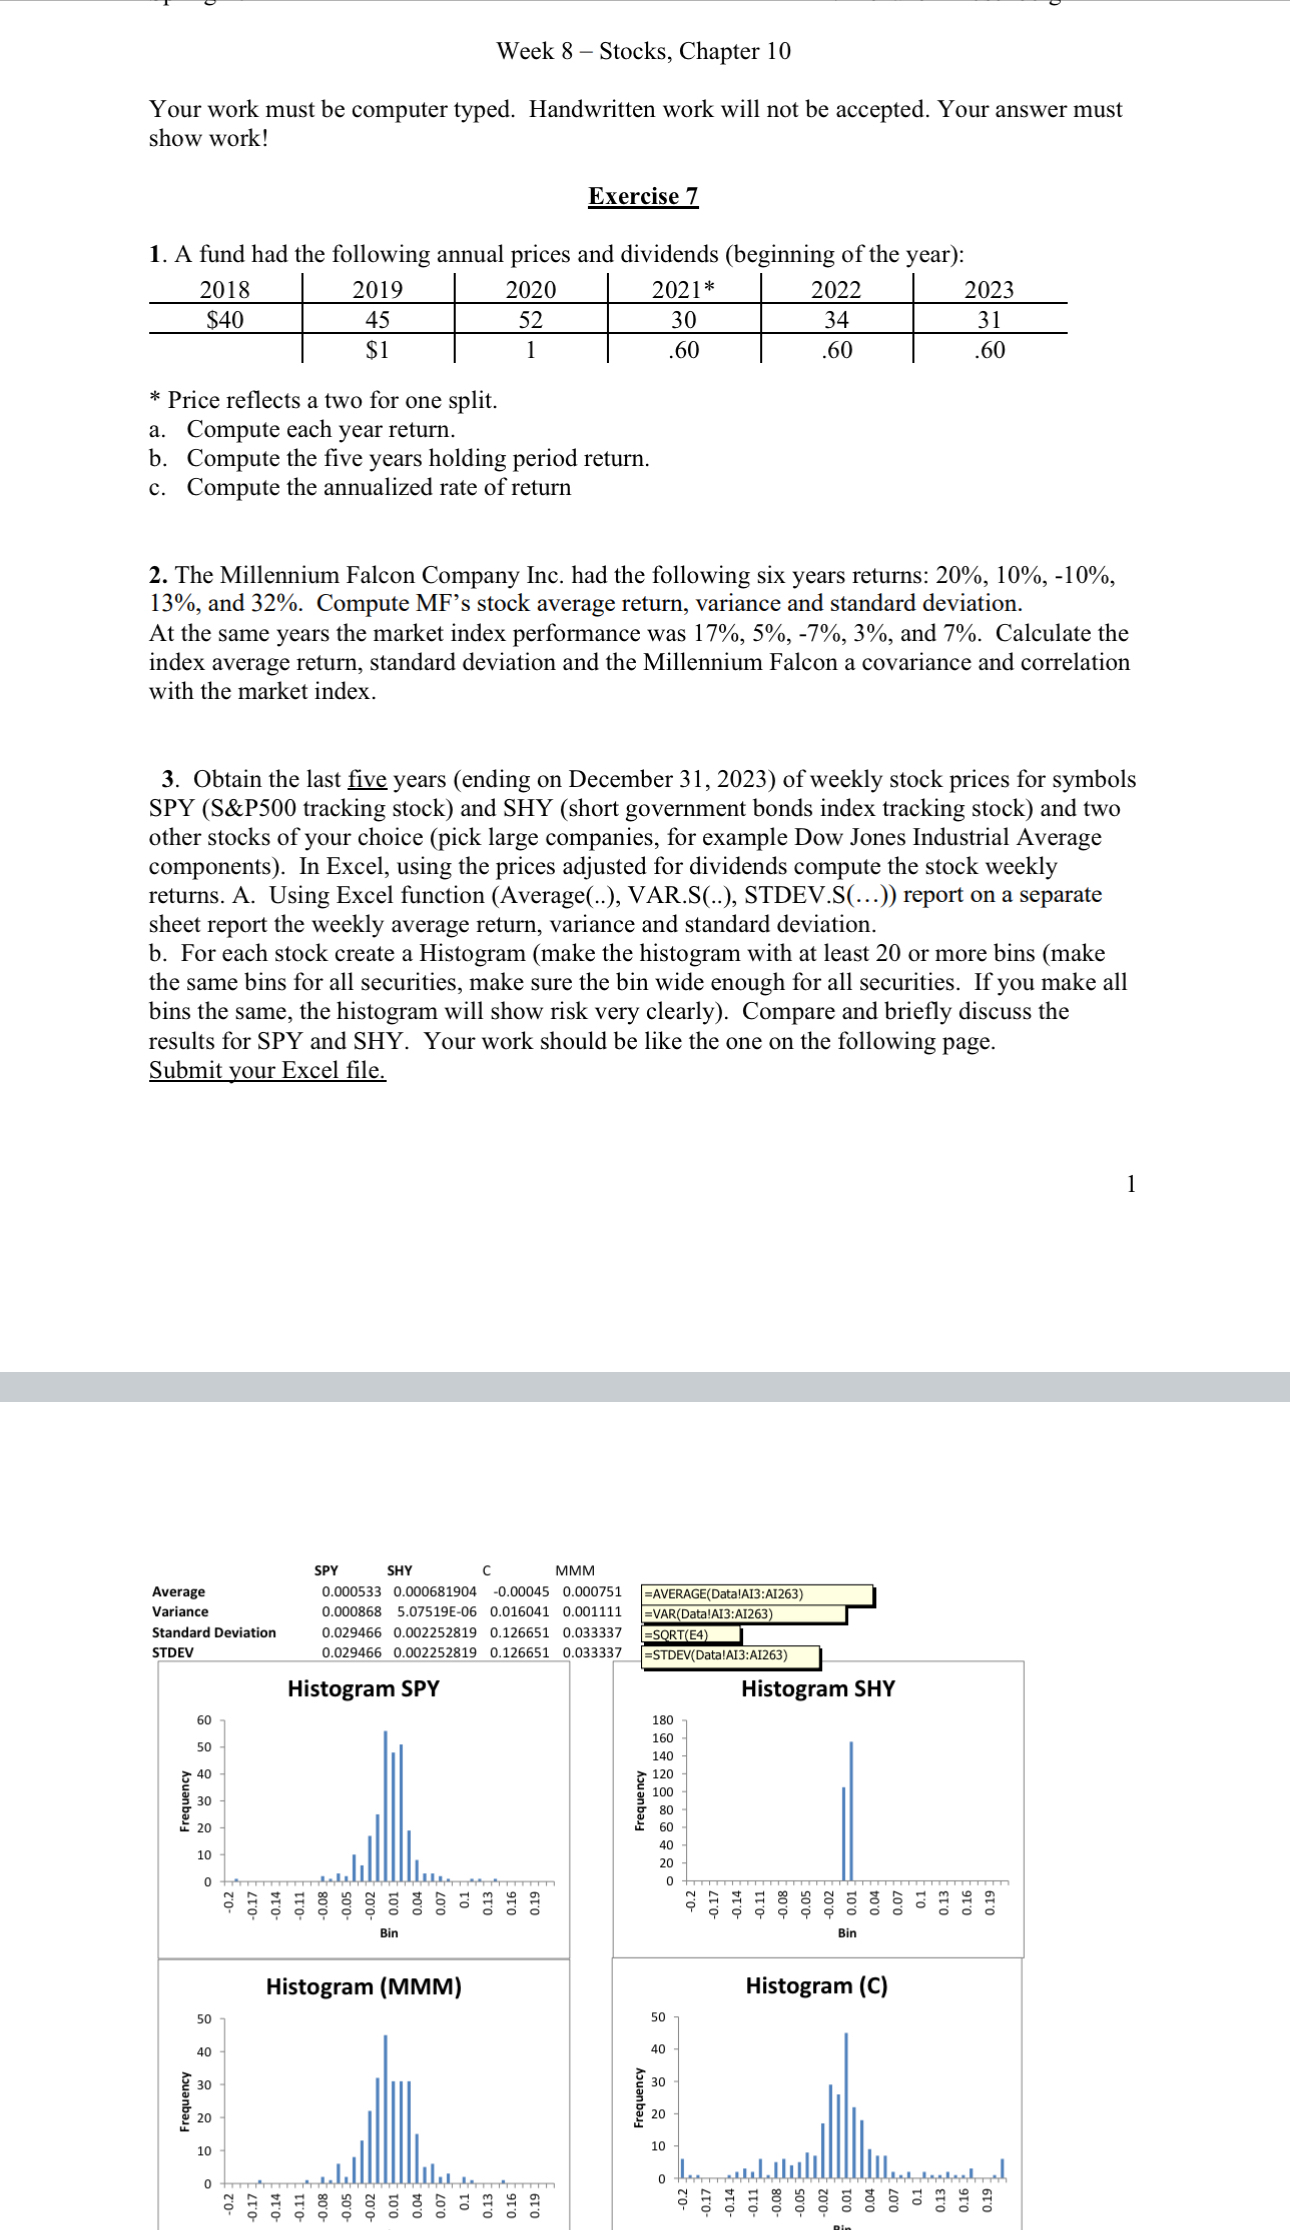
Obtain the last five years ending on December of weekly stock prices for symbols SPY S&P tracking stock and SHY short government bonds index tracking stock and two other stocks of your choice pick large companies, for example Dow Jones Industrial Average components In Excel, using the prices adjusted for dividends compute the stock weekly returns. A Using Excel function Average VAR.S STDEV.S report on a separate sheet report the weekly average return, variance and standard deviation.
b For each stock create a Histogram make the histogram with at least or more bins make the same bins for all securities make sure the bin wide enough for all securities If you make all bins the same, the histogram will show risk very clearly Compare and briefly discuss the results for SPY and SHY. Your work should be like the one on the following page. Submit your Excel file.
Step by Step Solution
There are 3 Steps involved in it
Step: 1

Get Instant Access to Expert-Tailored Solutions
See step-by-step solutions with expert insights and AI powered tools for academic success
Step: 2

Step: 3
Ace Your Homework with AI
Get the answers you need in no time with our AI-driven, step-by-step assistance
Get Started
Multinational Business Finance
Authors: David K. Eiteman, Arthur I. Stonehill, Michael H. Moffett
15th edition
134796551, 134796550, 978-0134796550