Answered step by step
Verified Expert Solution
Link Copied!

Question

1 Approved Answer

Week Value 24 Consider the time-series data in columns A and B to the left. (40 points) 13 AWNH 20 a. Construct a time series
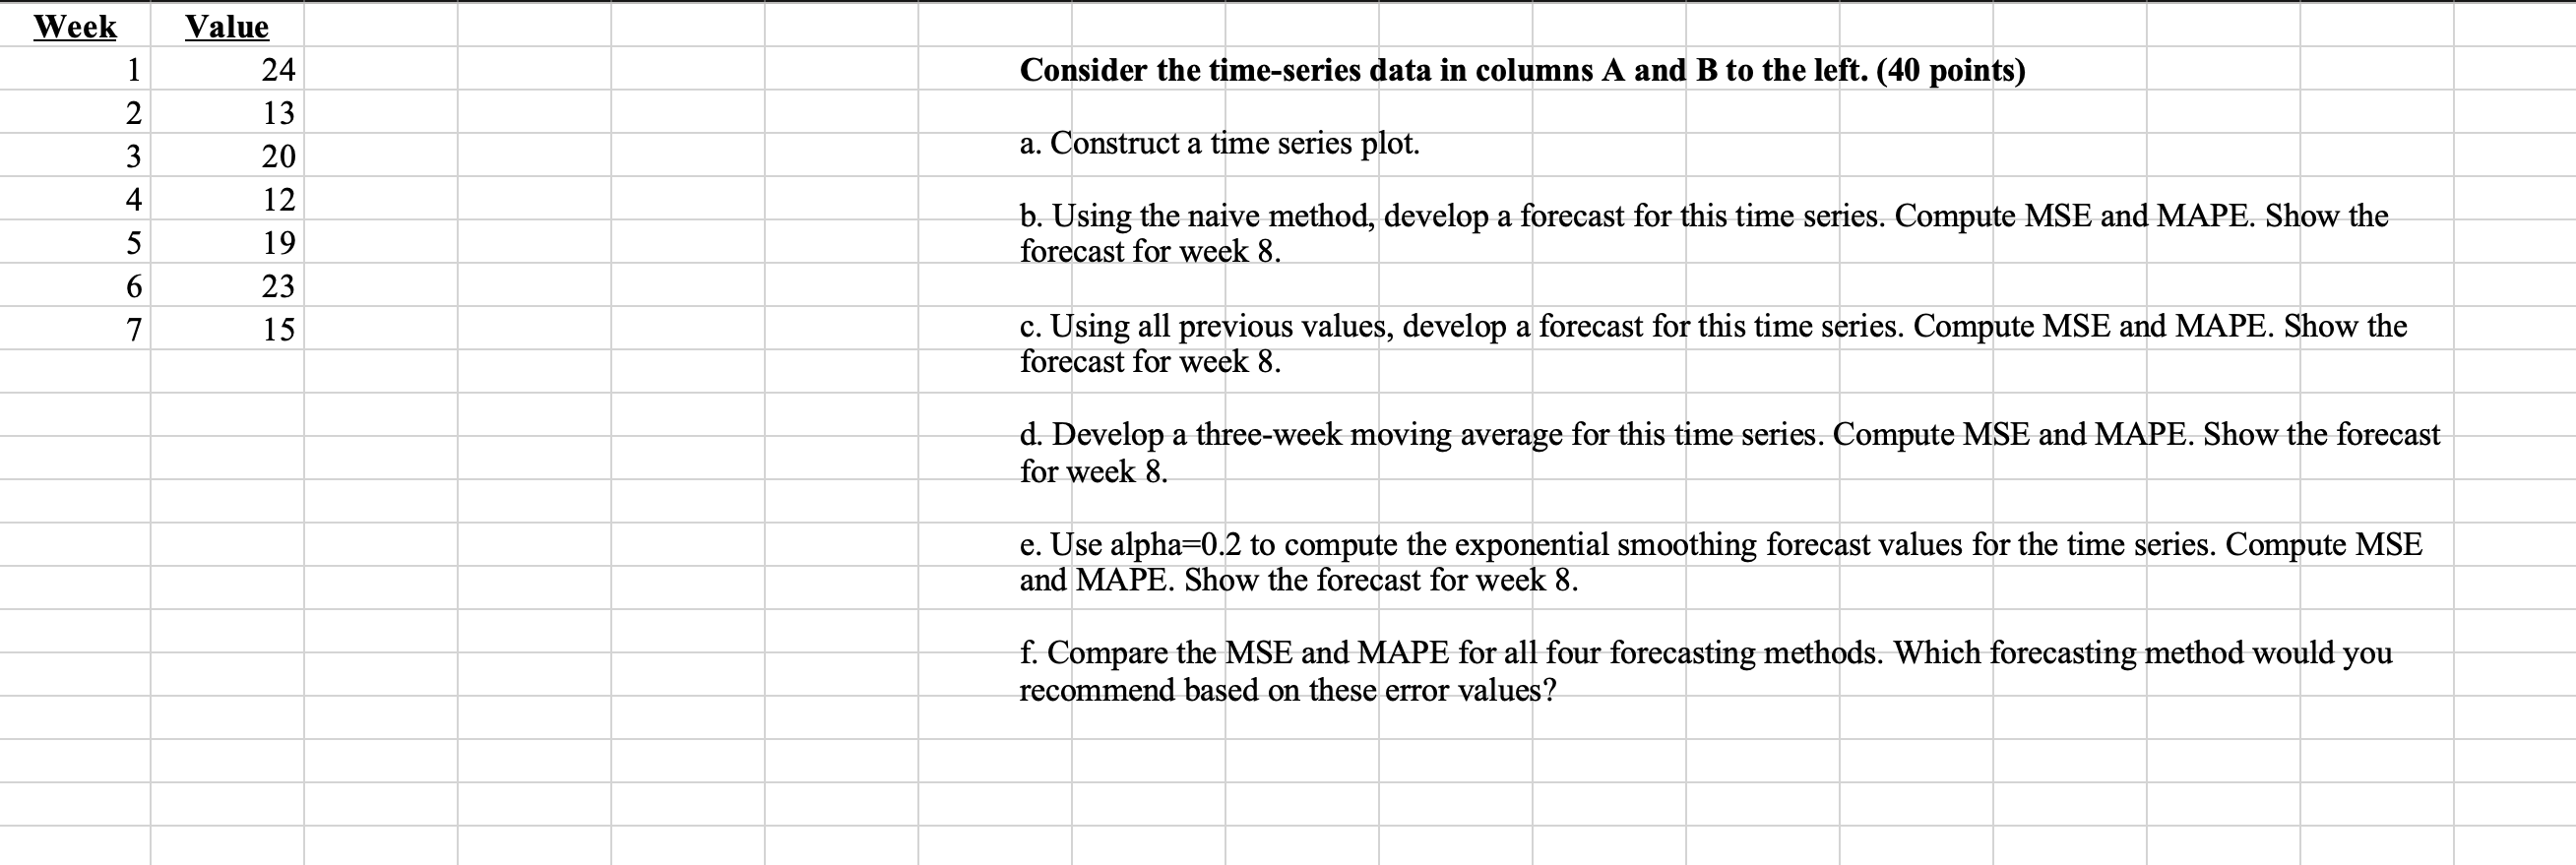
image text in transcribed
Week Value 24 Consider the time-series data in columns A and B to the left. (40 points) 13 AWNH 20 a. Construct a time series plot. 12 19 b. Using the naive method, develop a forecast for this time series. Compute MSE and MAPE. Show the forecast for week 8. 23 15 c. Using all previous values, develop a forecast for this time series. Compute MSE and MAPE. Show the forecast for week 8. d. Develop a three-week moving average for this time series. Compute MSE and MAPE. Show the forecast for week 8. e. Use alpha=0.2 to compute the exponential smoothing forecast values for the time series. Compute MSE and MAPE. Show the forecast for week 8. f. Compare the MSE and MAPE for all four forecasting methods. Which forecasting method would you recommend based on these error values

Step by Step Solution

There are 3 Steps involved in it

Step: 1

blur-text-image

Get Instant Access to Expert-Tailored Solutions

See step-by-step solutions with expert insights and AI powered tools for academic success

Step: 2

blur-text-image

Step: 3

blur-text-image

Ace Your Homework with AI

Get the answers you need in no time with our AI-driven, step-by-step assistance

Get Started

Recommended Textbook for

Finite Mathematics and Its Applications

Authors: Larry J. Goldstein, David I. Schneider, Martha J. Siegel, Steven Hair

12th edition

978-0134768588, 9780134437767, 134768582, 134437764, 978-0134768632

More Books

Students also viewed these Mathematics questions

Question

What is electric dipole explain with example

Answered: 1 week ago

Question

What is polarization? Describe it with examples.

Answered: 1 week ago