

Question: welgl Height If a sample is taken, a line can also be drawn. A hypothesis may ask if the correlation in the sample is strong
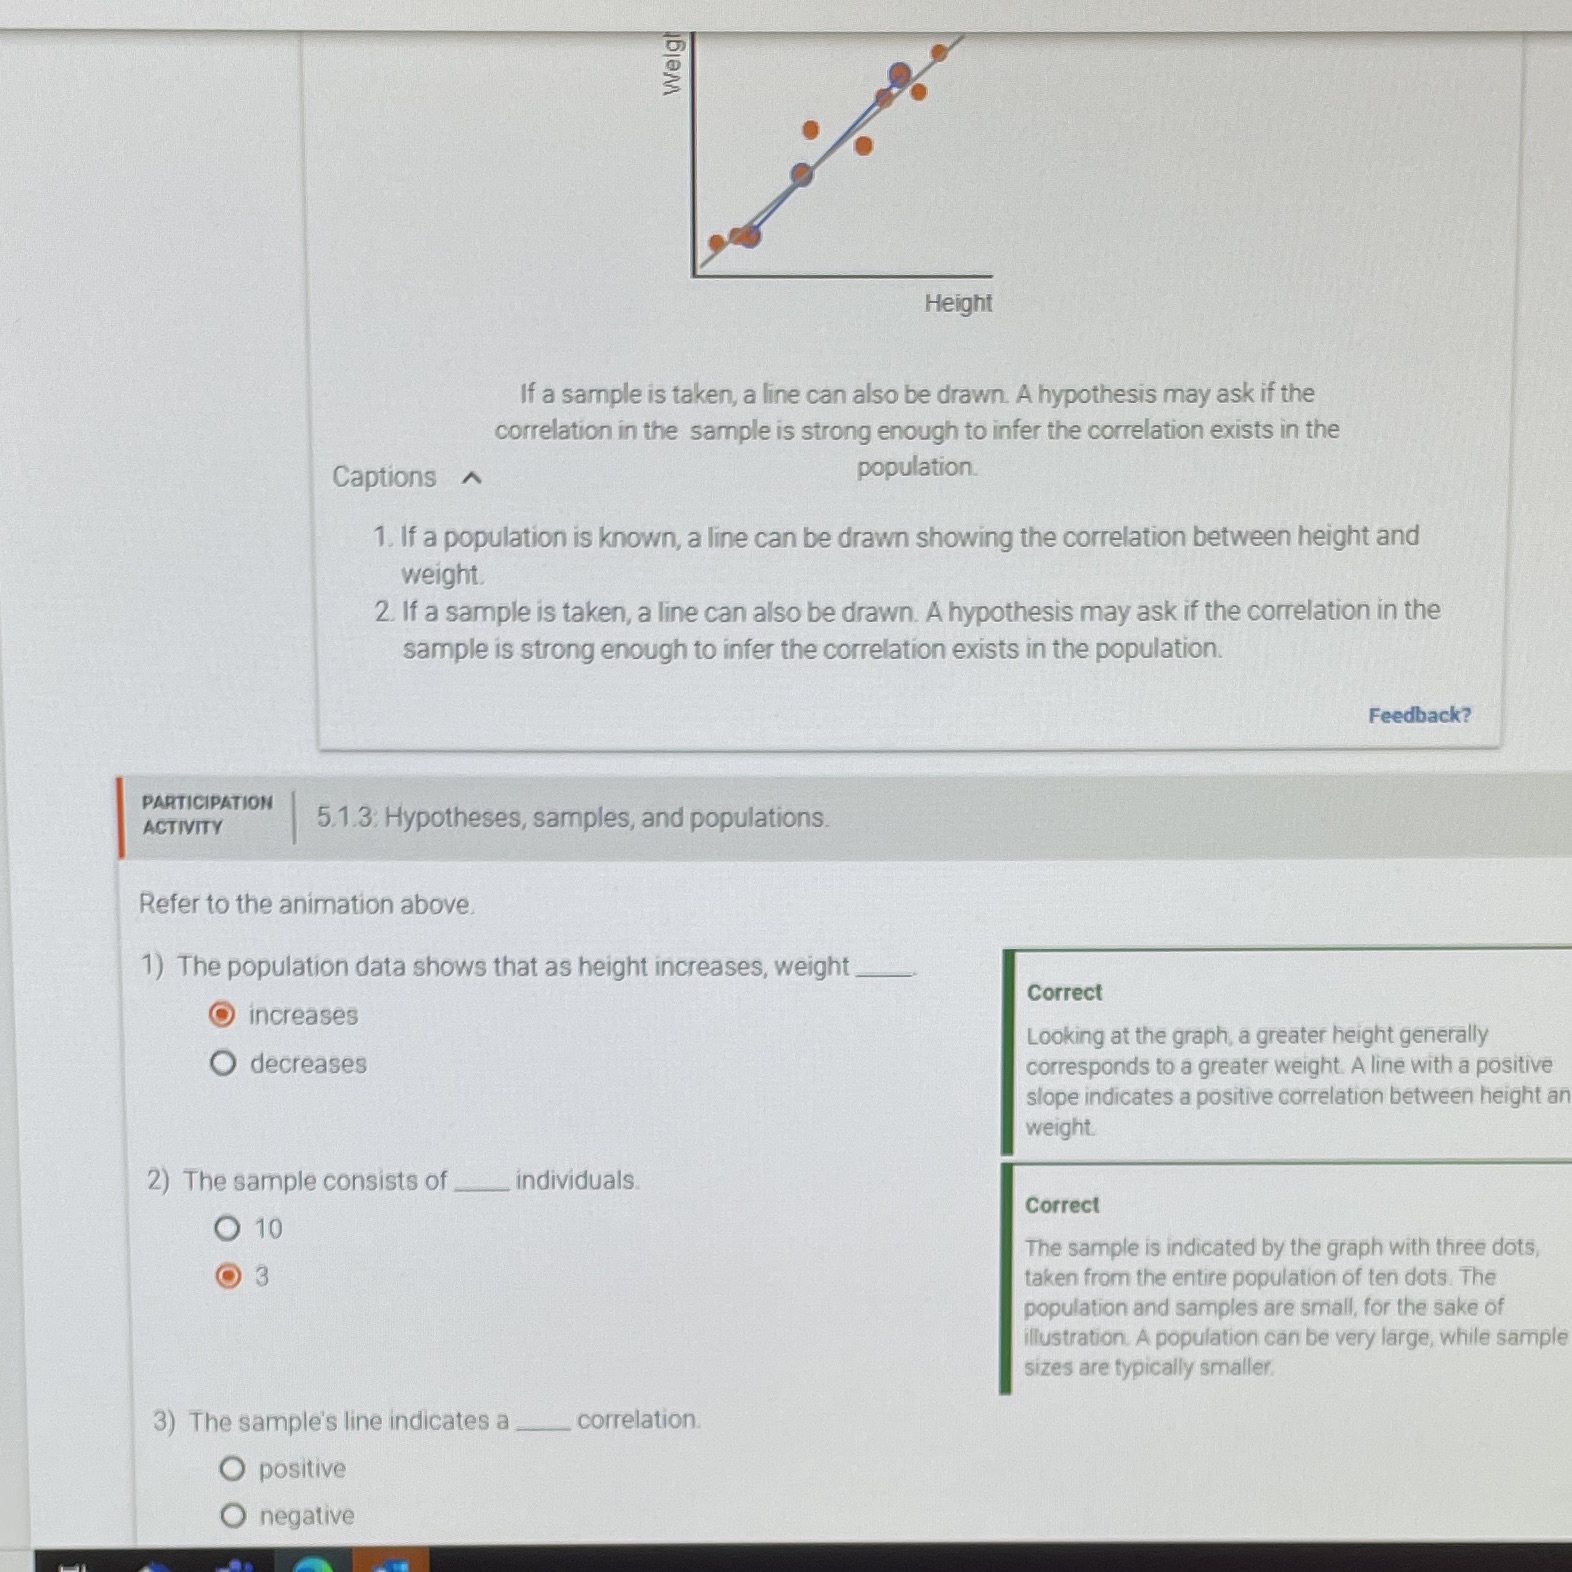
welgl Height If a sample is taken, a line can also be drawn. A hypothesis may ask if the correlation in the sample is strong enough to infer the correlation exists in the Captions ~ population. 1. If a population is known, a line can be drawn showing the correlation between height and weight. 2. If a sample is taken, a line can also be drawn. A hypothesis may ask if the correlation in the sample is strong enough to infer the correlation exists in the population. Feedback? PARTICIPATION ACTIVITY 5.1.3: Hypotheses, samples, and populations. Refer to the animation above. 1) The population data shows that as height increases, weight_ Correct increases Looking at the graph, a greater height generally O decreases corresponds to a greater weight. A line with a positive slope indicates a positive correlation between height ar weight 2) The sample consists of _ individuals. Correct O 10 The sample is indicated by the graph with three dots, 3 taken from the entire population of ten dots. The population and samples are small, for the sake of illustration. A population can be very large, while sample sizes are typically smaller. 3) The sample's line indicates a correlation. positive negative
Step by Step Solution
There are 3 Steps involved in it

Get step-by-step solutions from verified subject matter experts