

Answered step by step
Verified Expert Solution
Question
1 Approved Answer
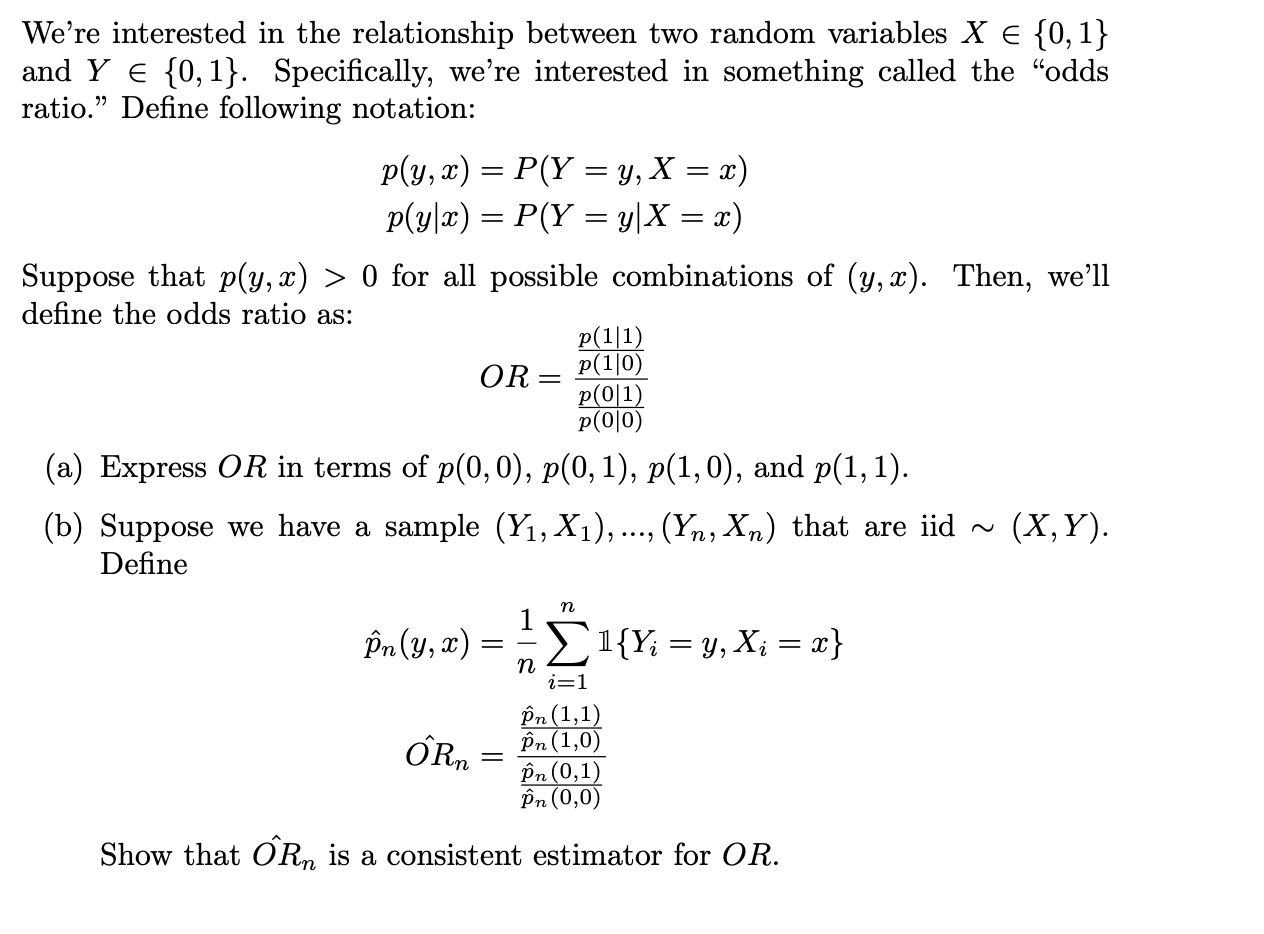
We're interested in the relationship between two random variables X{0,1} and Y{0,1}. Specifically, we're interested in something called the odds ratio. Define following notation: p(y,x)=P(Y=y,X=x)p(yx)=P(Y=yX=x)
Step by Step Solution
There are 3 Steps involved in it
Step: 1

Get Instant Access to Expert-Tailored Solutions
See step-by-step solutions with expert insights and AI powered tools for academic success
Step: 2

Step: 3
Ace Your Homework with AI
Get the answers you need in no time with our AI-driven, step-by-step assistance
Get Started
Pocket CIO The Guide To Successful IT Asset Management Get To Grips With The Fundamentals Of IT Asset Management Software Asset Management And Software License Compliance Audits With This Guide
Authors: Phara Estime McLachlan
1st Edition
1783001003, 978-1783001002