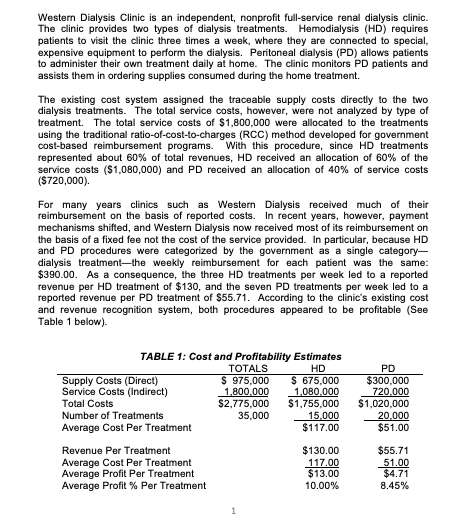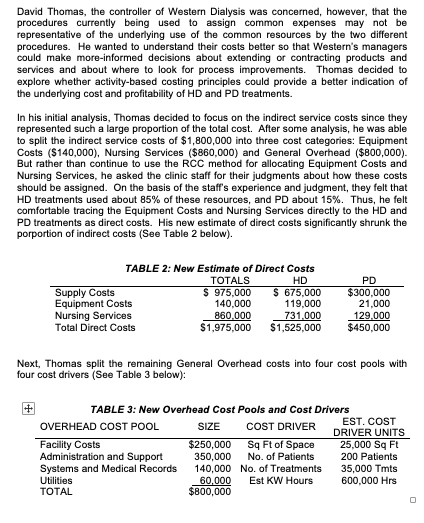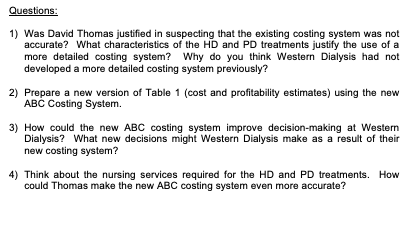


Western Dialysis Clinic is an independent, nonprofit full-service renal dialysis clinic. The clinic provides two types of dialysis treatments. Hemodialysis (HD) requires patients to visit the clinic three times a week, where they are connected to special, expensive equipment to perform the dialysis. Peritoneal dialysis (PD) allows patients to administer their own treatment daily at home. The clinic monitors PD patients and assists them in ordering supplies consumed during the home treatment. The existing cost system assigned the traceable supply costs directly to the two dialysis treatments. The total service costs, however, were not analyzed by type of treatment. The total service costs of $1,800,000 were allocated to the treatments using the traditional ratio-of-cost-to-charges (RCC) method developed for government cost-based reimbursement programs. With this procedure, since HD treatments represented about 60% of total revenues, HD received an allocation of 60% of the service costs ($1,080,000) and PD received an allocation of 40% of service costs ($720,000) For many years clinics such as Western Dialysis received much of their reimbursement on the basis of reported costs. In recent years, however, payment mechanisms shifted, and Western Dialysis now received most of its reimbursement on the basis of a fixed fee not the cost of the service provided. In particular, because HD and PD procedures were categorized by the government as a single category- dialysis treatmentthe weekly reimbursement for each patient was the same: $390.00. As a consequence, the three HD treatments per week led to a reported revenue per HD treatment of $130, and the seven PD treatments per week led to a reported revenue per PD treatment of $55.71. According to the clinic's existing cost and revenue recognition system, both procedures appeared to be profitable (See Table 1 below). TABLE 1: Cost and Profitability Estimates TOTALS HD Supply Costs (Direct) S 975,000 $ 675,000 Service Costs (Indirect) 1.800.000 1,080.000 Total Costs $2,775,000 $1,755,000 Number of Treatments 35,000 15,000 Average Cost Per Treatment $117.00 PD $300,000 720.000 $1,020,000 20.000 $51.00 Revenue Per Treatment Average Cost Per Treatment Average Profit Per Treatment Average Profit % Per Treatment $130.00 117.00 $13.00 10.00% $55.71 51.00 $4.71 8.45% David Thomas, the controller of Western Dialysis was concerned, however, that the procedures currently being used to assign common expenses may not be representative of the underlying use of the common resources by the two different procedures. He wanted to understand their costs better so that Western's managers could make more-informed decisions about extending or contracting products and services and about where to look for process improvements. Thomas decided to explore whether activity-based costing principles could provide a better indication of the underlying cost and profitability of HD and PD treatments. In his initial analysis, Thomas decided to focus on the indirect service costs since they represented such a large proportion of the total cost. After some analysis, he was able to split the indirect service costs of $1,800,000 into three cost categories: Equipment Costs ($140,000), Nursing Services ($860,000) and General Overhead ($800,000). But rather than continue to use the RCC method for allocating Equipment Costs and Nursing Services, he asked the clinic staff for their judgments about how these costs should be assigned. On the basis of the staff's experience and judgment, they felt that HD treatments used about 85% of these resources, and PD about 15%. Thus, he felt comfortable tracing the Equipment Costs and Nursing Services directly to the HD and PD treatments as direct costs. His new estimate of direct costs significantly shrunk the porportion of indirect costs (See Table 2 below). TABLE 2: New Estimate of Direct Costs TOTALS HD Supply Costs S 975,000 $ 675,000 Equipment Costs 140,000 119,000 Nursing Services 860.000 731,000 Total Direct Costs $1,975,000 $1,525,000 PD $300,000 21,000 129.000 $450,000 Next, Thomas split the remaining General Overhead costs into four cost pools with four cost drivers (See Table 3 below): TABLE 3: New Overhead Cost Pools and Cost Drivers OVERHEAD COST POOL EST. COST SIZE COST DRIVER DRIVER UNITS Facility Costs $250,000 Sq Ft of Space 25,000 Sq Ft Administration and Support 350,000 No. of Patients 200 Patients Systems and Medical Records 140,000 No. of Treatments 35,000 Tmts Utilities 60,000 Est KW Hours 600,000 Hrs TOTAL $800,000 Finally, Thomas identified the consumption of the cost drivers by each of the two products for the past year (See Table 4 below). TABLE 4: Consumption of Overhead Cost Drivers TOTALS HD Sq Ft of Space 25,000 15,000 No. of Patients 200 120 No. of Treatments 35,000 15,000 Est KW Hours 600,000 500,000 PD 10,000 80 20,000 100,000 Questions: 1) Was David Thomas justified in suspecting that the existing costing system was not accurate? What characteristics of the HD and PD treatments justify the use of a more detailed costing system? Why do you think Western Dialysis had not developed a more detailed costing system previously? 2) Prepare a new version of Table 1 (cost and profitability estimates) using the new ABC Costing System. 3) How could the new ABC costing system improve decision-making at Western Dialysis? What new decisions might Western Dialysis make as a result of their new costing system? 4) Think about the nursing services required for the HD and PD treatments. How could Thomas make the new ABC costing system even more accurate? Western Dialysis Clinic is an independent, nonprofit full-service renal dialysis clinic. The clinic provides two types of dialysis treatments. Hemodialysis (HD) requires patients to visit the clinic three times a week, where they are connected to special, expensive equipment to perform the dialysis. Peritoneal dialysis (PD) allows patients to administer their own treatment daily at home. The clinic monitors PD patients and assists them in ordering supplies consumed during the home treatment. The existing cost system assigned the traceable supply costs directly to the two dialysis treatments. The total service costs, however, were not analyzed by type of treatment. The total service costs of $1,800,000 were allocated to the treatments using the traditional ratio-of-cost-to-charges (RCC) method developed for government cost-based reimbursement programs. With this procedure, since HD treatments represented about 60% of total revenues, HD received an allocation of 60% of the service costs ($1,080,000) and PD received an allocation of 40% of service costs ($720,000) For many years clinics such as Western Dialysis received much of their reimbursement on the basis of reported costs. In recent years, however, payment mechanisms shifted, and Western Dialysis now received most of its reimbursement on the basis of a fixed fee not the cost of the service provided. In particular, because HD and PD procedures were categorized by the government as a single category- dialysis treatmentthe weekly reimbursement for each patient was the same: $390.00. As a consequence, the three HD treatments per week led to a reported revenue per HD treatment of $130, and the seven PD treatments per week led to a reported revenue per PD treatment of $55.71. According to the clinic's existing cost and revenue recognition system, both procedures appeared to be profitable (See Table 1 below). TABLE 1: Cost and Profitability Estimates TOTALS HD Supply Costs (Direct) S 975,000 $ 675,000 Service Costs (Indirect) 1.800.000 1,080.000 Total Costs $2,775,000 $1,755,000 Number of Treatments 35,000 15,000 Average Cost Per Treatment $117.00 PD $300,000 720.000 $1,020,000 20.000 $51.00 Revenue Per Treatment Average Cost Per Treatment Average Profit Per Treatment Average Profit % Per Treatment $130.00 117.00 $13.00 10.00% $55.71 51.00 $4.71 8.45% David Thomas, the controller of Western Dialysis was concerned, however, that the procedures currently being used to assign common expenses may not be representative of the underlying use of the common resources by the two different procedures. He wanted to understand their costs better so that Western's managers could make more-informed decisions about extending or contracting products and services and about where to look for process improvements. Thomas decided to explore whether activity-based costing principles could provide a better indication of the underlying cost and profitability of HD and PD treatments. In his initial analysis, Thomas decided to focus on the indirect service costs since they represented such a large proportion of the total cost. After some analysis, he was able to split the indirect service costs of $1,800,000 into three cost categories: Equipment Costs ($140,000), Nursing Services ($860,000) and General Overhead ($800,000). But rather than continue to use the RCC method for allocating Equipment Costs and Nursing Services, he asked the clinic staff for their judgments about how these costs should be assigned. On the basis of the staff's experience and judgment, they felt that HD treatments used about 85% of these resources, and PD about 15%. Thus, he felt comfortable tracing the Equipment Costs and Nursing Services directly to the HD and PD treatments as direct costs. His new estimate of direct costs significantly shrunk the porportion of indirect costs (See Table 2 below). TABLE 2: New Estimate of Direct Costs TOTALS HD Supply Costs S 975,000 $ 675,000 Equipment Costs 140,000 119,000 Nursing Services 860.000 731,000 Total Direct Costs $1,975,000 $1,525,000 PD $300,000 21,000 129.000 $450,000 Next, Thomas split the remaining General Overhead costs into four cost pools with four cost drivers (See Table 3 below): TABLE 3: New Overhead Cost Pools and Cost Drivers OVERHEAD COST POOL EST. COST SIZE COST DRIVER DRIVER UNITS Facility Costs $250,000 Sq Ft of Space 25,000 Sq Ft Administration and Support 350,000 No. of Patients 200 Patients Systems and Medical Records 140,000 No. of Treatments 35,000 Tmts Utilities 60,000 Est KW Hours 600,000 Hrs TOTAL $800,000 Finally, Thomas identified the consumption of the cost drivers by each of the two products for the past year (See Table 4 below). TABLE 4: Consumption of Overhead Cost Drivers TOTALS HD Sq Ft of Space 25,000 15,000 No. of Patients 200 120 No. of Treatments 35,000 15,000 Est KW Hours 600,000 500,000 PD 10,000 80 20,000 100,000 Questions: 1) Was David Thomas justified in suspecting that the existing costing system was not accurate? What characteristics of the HD and PD treatments justify the use of a more detailed costing system? Why do you think Western Dialysis had not developed a more detailed costing system previously? 2) Prepare a new version of Table 1 (cost and profitability estimates) using the new ABC Costing System. 3) How could the new ABC costing system improve decision-making at Western Dialysis? What new decisions might Western Dialysis make as a result of their new costing system? 4) Think about the nursing services required for the HD and PD treatments. How could Thomas make the new ABC costing system even more accurate


