

Answered step by step
Verified Expert Solution
Question
1 Approved Answer
what accounts are deferral? what accounts are accural? what are sates on statement if financial position? 2019 2018 2017 As Adjusted 2015 As Adjusted 2015
what accounts are deferral? what accounts are accural? what are sates on statement if financial position? 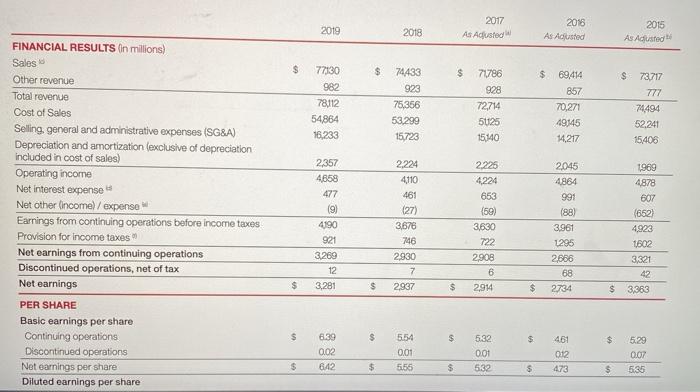
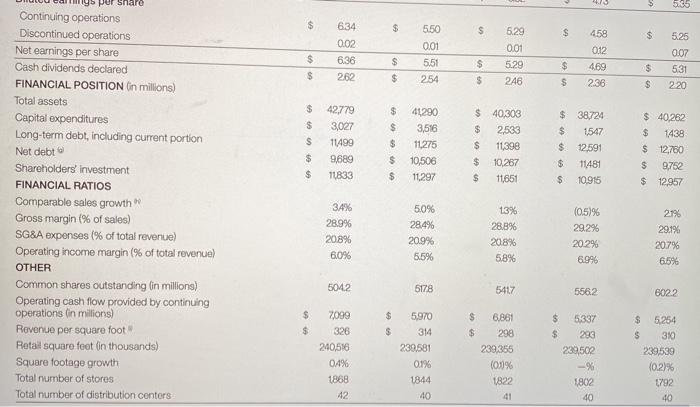 2019 2018 2017 As Adjusted 2015 As Adjusted 2015 As Adjusted $ $ $ $ $ 73.717 77130 982 78112 54864 16,233 74433 923 75,356 53299 15723 71786 928 72,714 5025 15140 69,414 857 70,271 49345 14,217 777 74494 52.241 15406 FINANCIAL RESULTS In millions) Sales Other revenue Total revenue Cost of Sales Selling, general and administrative expenses (SG&A) Depreciation and amortization (exclusive of depreciation included in cost of sales) Operating income Net interest expenses Net other income) / expense Earnings from continuing operations before income taxes Provision for Income taxes Net earnings from continuing operations Discontinued operations, net of tax Net earnings 2357 4858 477 (9) 4190 921 3269 12 3.281 2.224 4110 461 (27) 3,676 746 2930 7 2937 2.225 4224 653 (59) 3,630 722 2,908 2045 4864 991 (88) 3,961 1295 2866 68 2734 1969 4878 607 (652) 4923 1602 3,321 42 $ 3363 6 $ $ $ 2,914 $ $ $ $ $ 461 $ PER SHARE Basic earnings per share Continuing operations Discontinued operations Net earnings per share Diluted earnings por share 6.39 0.02 642 5.54 0.01 5.55 532 0.01 532 5.29 0.07 5:35 012 473 $ $ $ S $ per snare 5605 $ $ $ $ $ 5.25 634 0.02 636 550 001 5.51 254 0.07 $ $ $ $ 5.29 001 5.29 246 458 012 469 236 $ $ 262 $ $ $ $ 531 220 $ $ $ $ 1547 S 42779 3,027 11499 9689 11833 $ 41290 3,516 11275 10,506 11.297 $ 40,303 $ 2,533 $ 11398 $ 10,287 $ 11,651 $ 38724 $ $ 12.591 $ 11481 $ 10915 $ 40.262 $ 1438 $ 12,760 $ 9,752 $ 12,957 $ $ $ $ Continuing operations Discontinued operations Net earnings per share Cash dividends declared FINANCIAL POSITION On millions) Total assets Capital expenditures Long-term debt, including current portion Net debt Shareholders' investment FINANCIAL RATIOS Comparable sales growth Gross margin (% of sales) SG&A expenses (% of total revenue) Operating income margin (% of total revenue) OTHER Common shares outstanding in millions) Operating cash flow provided by continuing operations in millions) Revenue per square foot Retail square foot in thousands) Square footage growth Total number of storos Total number of distribution contors 34% 28.9% 208% 60% 50% 28.4% 209% 5.5% 13% 28.8% 20.8% 5.8% (0.5)% 29.2% 20.2% 6.996 21% 29.1% 20.7% 6.5% 5042 5178 5417 5562 6022 $ $ $ $ $ $ 7099 326 240,516 04% 1868 5.970 314 239581 0.1% 1844 40 6.881 298 2392355 (0,0% 1822 $ 5337 $ 293 239,502 - % 1802 40 $ 5,254 S 310 239,539 (0.2% 1792 40 42
what accounts are deferral?
what accounts are accural?
what are sates on statement if financial position?
Step by Step Solution
There are 3 Steps involved in it
Step: 1

Get Instant Access to Expert-Tailored Solutions
See step-by-step solutions with expert insights and AI powered tools for academic success
Step: 2

Step: 3
Ace Your Homework with AI
Get the answers you need in no time with our AI-driven, step-by-step assistance
Get Started
Provider Audit In England Evaluating Medical Audit
Authors: James Buttery, Yvette; Walshe, Kieran; Rumsey, Moira; Amess, Moyra; Bennett, Jennifer & Coles
1st Edition
1898845034, 978-1898845034