What actions could be taken to improve the performance of Sheffield Limited in each of the categories of financial ratios (efficiency ratios, financial stability ratios, and profitability ratios)?
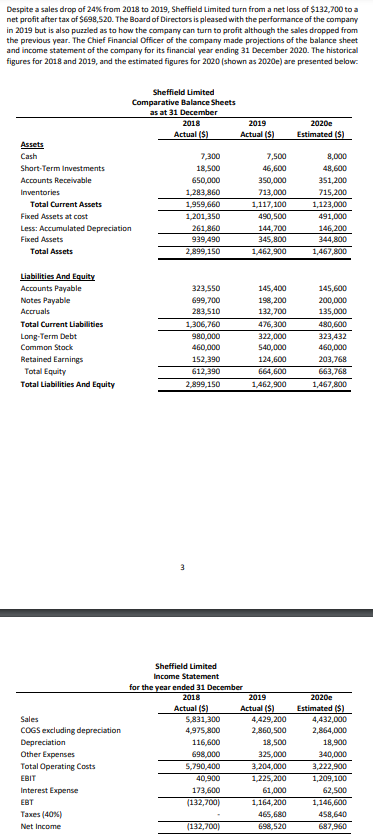
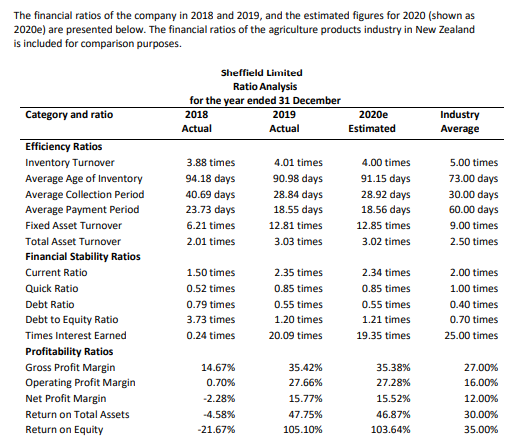
Despite a sales drop of 24% from 2018 to 2019, Sheffield Limited turn from a net loss of $132,700 to a net profit after tax of $698,520. The Board of Directors is pleased with the performance of the company in 2019 but is also puzzled as to how the company can turn to profit although the sales dropped from the previous year. The Chief Financial Officer of the company made projections of the balance sheet and income statement of the company for its financial year ending 31 December 2020. The historical figures for 2018 and 2019, and the estimated figures for 2020 (shown as 2020e) are presented below. 2020 Estimated (5) Sheffield Limited Comparative Balance Sheets as at 31 December 2018 2019 Actual (S) Actual (5) Assets Cash 7,300 7,500 Short-Term Investments 18,500 46,600 Accounts Receivable 650,000 350,000 Inventories 1,283,860 713,000 Total Current Assets 1,959,660 1,117,100 Fixed Assets at cost 1,201,350 490,500 Less: Accumulated Depreciation 261 860 144,700 Fixed Assets 939,490 345,800 Total Assets 2.899,150 1,462.900 8,000 48,600 351,200 715,200 1,123,000 491,000 146,200 344,800 1,467,800 Liabilities And Equity Accounts Payable Notes Payable Accruals Total Current Liabilities Long-Term Debt Common Stock Retained Earnings Total Equity Total Liabilities And Equity 323,550 699,700 283,510 1,306,760 980,000 460,000 152,390 612,390 2.899,150 145,400 198,200 132,700 476,300 322,000 540,000 124,600 664,600 1,462,900 145,600 200,000 135,000 480,600 323,432 460,000 203,768 663,768 1,467,800 3 Sales COGS excluding depreciation Depreciation Other Expenses Total Operating Costs EBIT Interest Expense EBT Taxes (40%) Net Income Sheffield Limited Income Statement for the year ended 31 December 2018 2019 Actual ($) Actual (5) 5,831,300 4,429,200 4,975,800 2.860,500 116,600 18,500 698,000 325,000 5,790,400 3,204,000 40,900 1,225,200 173,600 61,000 (132,700) 1,164,200 465,680 (132,700) 698,520 2020e Estimated ($) 4,432,000 2,864,000 18,900 340,000 3,222.900 1,209,100 62,500 1,146,600 458,640 687,960 The financial ratios of the company in 2018 and 2019, and the estimated figures for 2020 (shown as 2020e) are presented below. The financial ratios of the agriculture products industry in New Zealand is included for comparison purposes. Sheffield Limited Ratio Analysis for the year ended 31 December Category and ratio 2018 2019 2020e Industry Actual Actual Estimated Average Efficiency Ratios Inventory Turnover 3.88 times 4.01 times 4.00 times 5.00 times Average Age of Inventory 94.18 days 90.98 days 91.15 days 73.00 days Average Collection Period 40.69 days 28.84 days 28.92 days 30.00 days Average Payment Period 23.73 days 18.55 days 18.56 days 60.00 days Fixed Asset Turnover 6.21 times 12.81 times 12.85 times 9.00 times Total Asset Turnover 2.01 times 3.03 times 3.02 times 2.50 times Financial Stability Ratios Current Ratio 1.50 times 2.35 times 2.34 times 2.00 times Quick Ratio 0.52 times 0.85 times 0.85 times 1.00 times Debt Ratio 0.79 times 0.55 times 0.55 times 0.40 times Debt to Equity Ratio 3.73 times 1.20 times 1.21 times 0.70 times Times Interest Earned 0.24 times 20.09 times 19.35 times 25.00 times Profitability Ratios Gross Profit Margin 14.67% 35.42% 35.38% 27.00% Operating Profit Margin 0.70% 27.66% 27.28% 16.00% Net Profit Margin -2.28% 15.77% 15.52% 12.00% Return on Total Assets -4.58% 47.75% 46.87% 30.00% Return on Equity -21.67% 105.10% 103.64% 35.00% Despite a sales drop of 24% from 2018 to 2019, Sheffield Limited turn from a net loss of $132,700 to a net profit after tax of $698,520. The Board of Directors is pleased with the performance of the company in 2019 but is also puzzled as to how the company can turn to profit although the sales dropped from the previous year. The Chief Financial Officer of the company made projections of the balance sheet and income statement of the company for its financial year ending 31 December 2020. The historical figures for 2018 and 2019, and the estimated figures for 2020 (shown as 2020e) are presented below. 2020 Estimated (5) Sheffield Limited Comparative Balance Sheets as at 31 December 2018 2019 Actual (S) Actual (5) Assets Cash 7,300 7,500 Short-Term Investments 18,500 46,600 Accounts Receivable 650,000 350,000 Inventories 1,283,860 713,000 Total Current Assets 1,959,660 1,117,100 Fixed Assets at cost 1,201,350 490,500 Less: Accumulated Depreciation 261 860 144,700 Fixed Assets 939,490 345,800 Total Assets 2.899,150 1,462.900 8,000 48,600 351,200 715,200 1,123,000 491,000 146,200 344,800 1,467,800 Liabilities And Equity Accounts Payable Notes Payable Accruals Total Current Liabilities Long-Term Debt Common Stock Retained Earnings Total Equity Total Liabilities And Equity 323,550 699,700 283,510 1,306,760 980,000 460,000 152,390 612,390 2.899,150 145,400 198,200 132,700 476,300 322,000 540,000 124,600 664,600 1,462,900 145,600 200,000 135,000 480,600 323,432 460,000 203,768 663,768 1,467,800 3 Sales COGS excluding depreciation Depreciation Other Expenses Total Operating Costs EBIT Interest Expense EBT Taxes (40%) Net Income Sheffield Limited Income Statement for the year ended 31 December 2018 2019 Actual ($) Actual (5) 5,831,300 4,429,200 4,975,800 2.860,500 116,600 18,500 698,000 325,000 5,790,400 3,204,000 40,900 1,225,200 173,600 61,000 (132,700) 1,164,200 465,680 (132,700) 698,520 2020e Estimated ($) 4,432,000 2,864,000 18,900 340,000 3,222.900 1,209,100 62,500 1,146,600 458,640 687,960 The financial ratios of the company in 2018 and 2019, and the estimated figures for 2020 (shown as 2020e) are presented below. The financial ratios of the agriculture products industry in New Zealand is included for comparison purposes. Sheffield Limited Ratio Analysis for the year ended 31 December Category and ratio 2018 2019 2020e Industry Actual Actual Estimated Average Efficiency Ratios Inventory Turnover 3.88 times 4.01 times 4.00 times 5.00 times Average Age of Inventory 94.18 days 90.98 days 91.15 days 73.00 days Average Collection Period 40.69 days 28.84 days 28.92 days 30.00 days Average Payment Period 23.73 days 18.55 days 18.56 days 60.00 days Fixed Asset Turnover 6.21 times 12.81 times 12.85 times 9.00 times Total Asset Turnover 2.01 times 3.03 times 3.02 times 2.50 times Financial Stability Ratios Current Ratio 1.50 times 2.35 times 2.34 times 2.00 times Quick Ratio 0.52 times 0.85 times 0.85 times 1.00 times Debt Ratio 0.79 times 0.55 times 0.55 times 0.40 times Debt to Equity Ratio 3.73 times 1.20 times 1.21 times 0.70 times Times Interest Earned 0.24 times 20.09 times 19.35 times 25.00 times Profitability Ratios Gross Profit Margin 14.67% 35.42% 35.38% 27.00% Operating Profit Margin 0.70% 27.66% 27.28% 16.00% Net Profit Margin -2.28% 15.77% 15.52% 12.00% Return on Total Assets -4.58% 47.75% 46.87% 30.00% Return on Equity -21.67% 105.10% 103.64% 35.00%