What amount of capital leases was reported by P&G in total and for less than one year? (Enter answers in millions.)
| | | Total | | Less than 1 year | |
| Capital lease | | $ ______million | | $ _______million |
What minimum annual rental commitments under all non-cancelable leases at June 30, 2017, did P&G disclose? (Enter answers in millions.)
| | | Noncancelable operating leases | |
| 2018 | | $ ________ million | |
| 2019 | | $ ________ million | |
| 2020 | | $ ________ million | |
| 2021 | | $ ________ million | |
| 2022 | | $ ________ million | |
| 2023 and beyond | | $ ________ million |
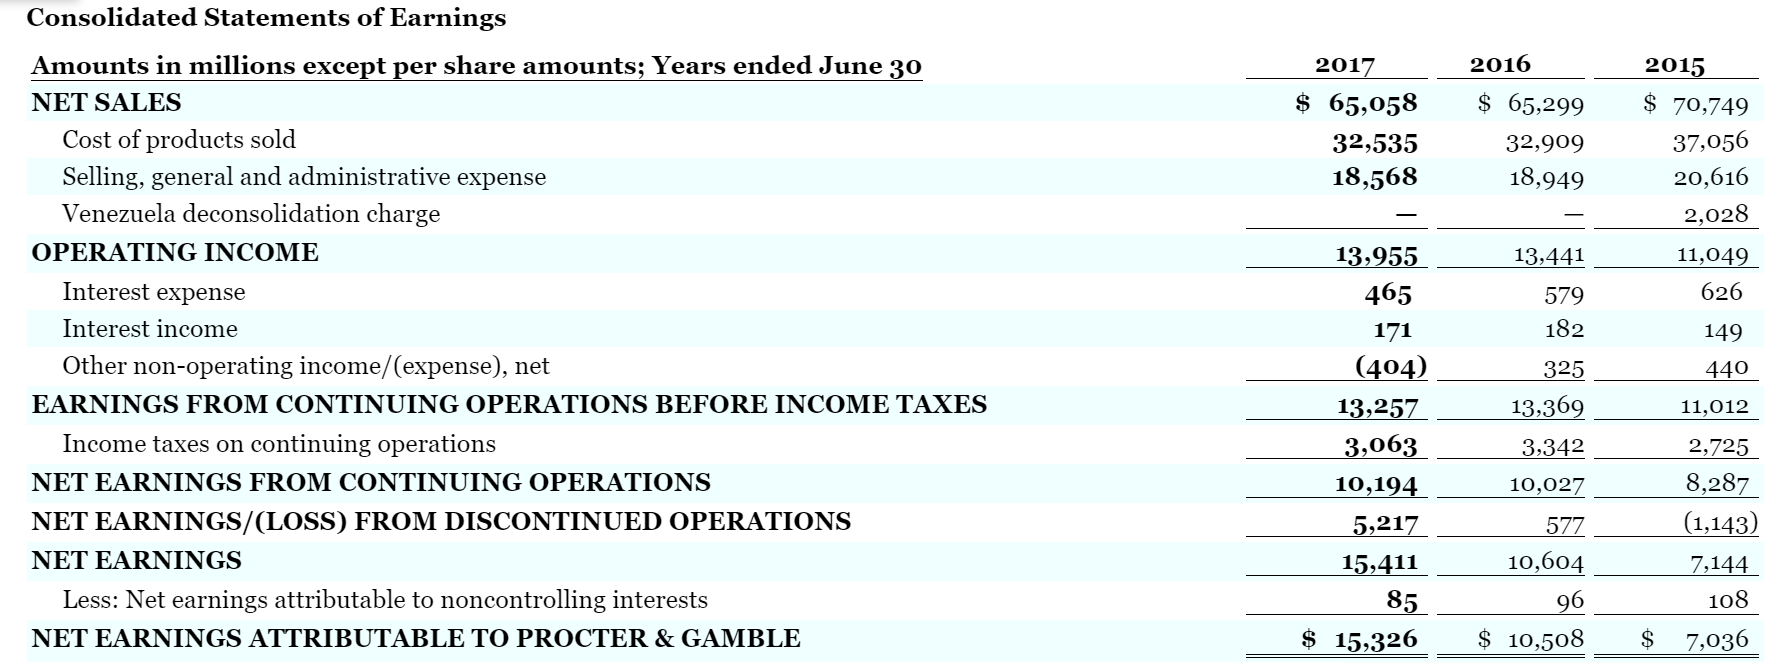
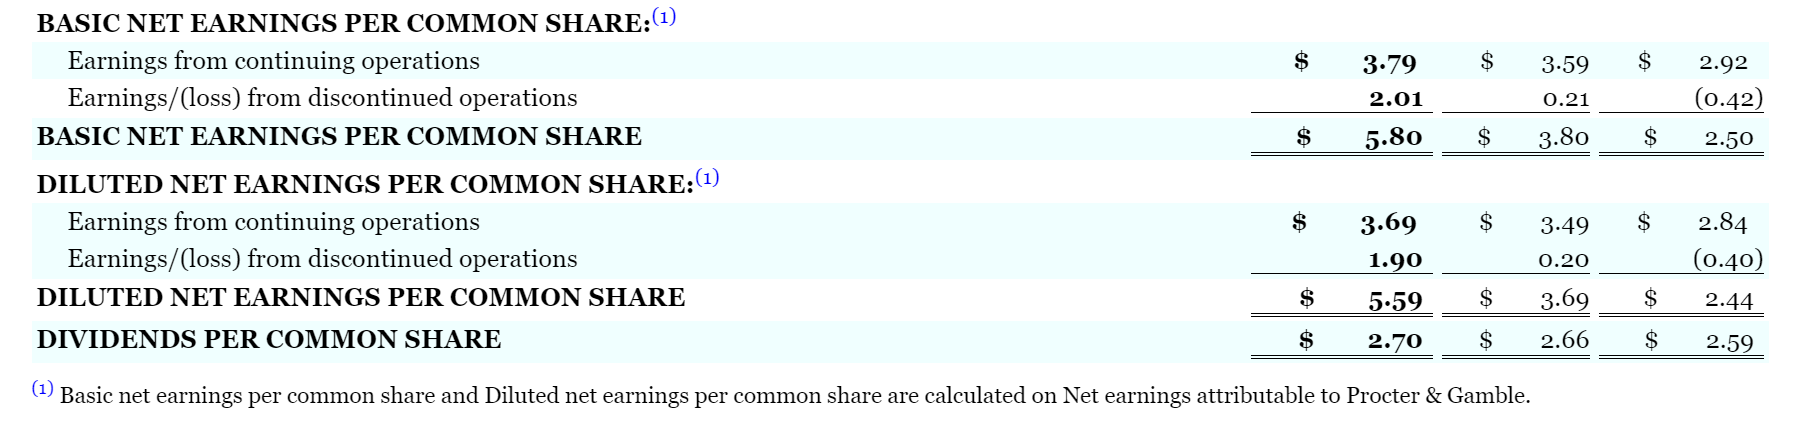
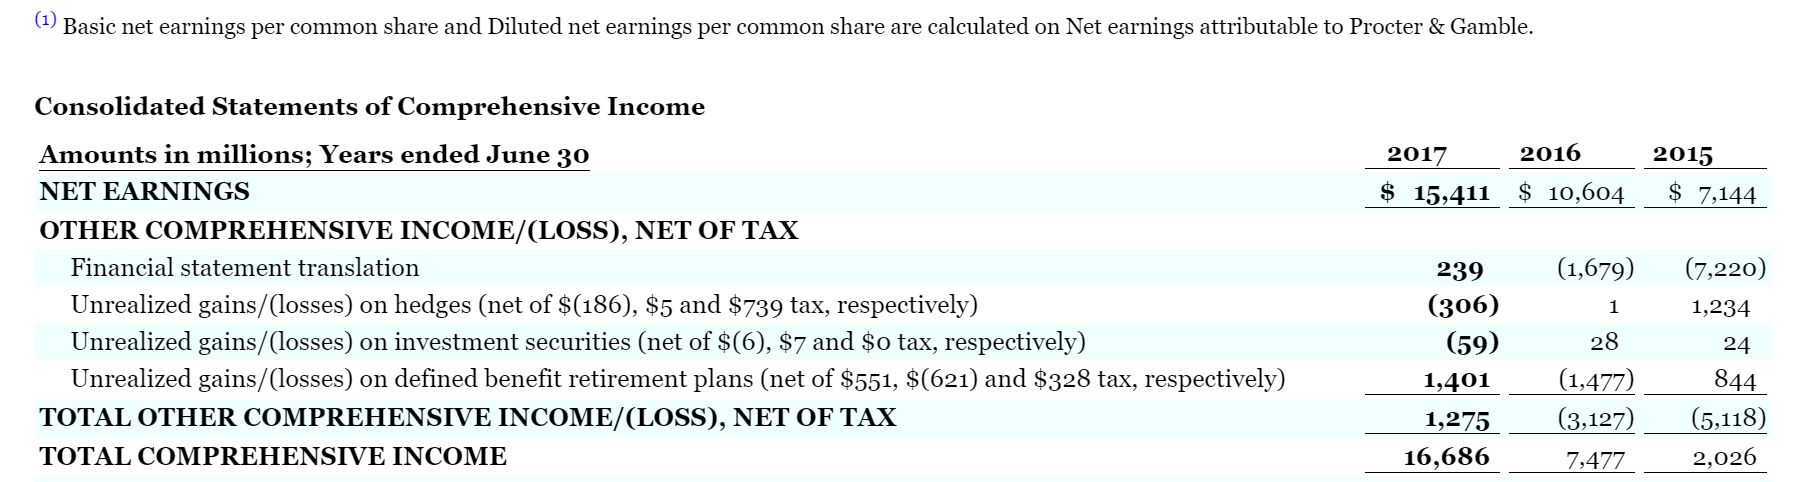
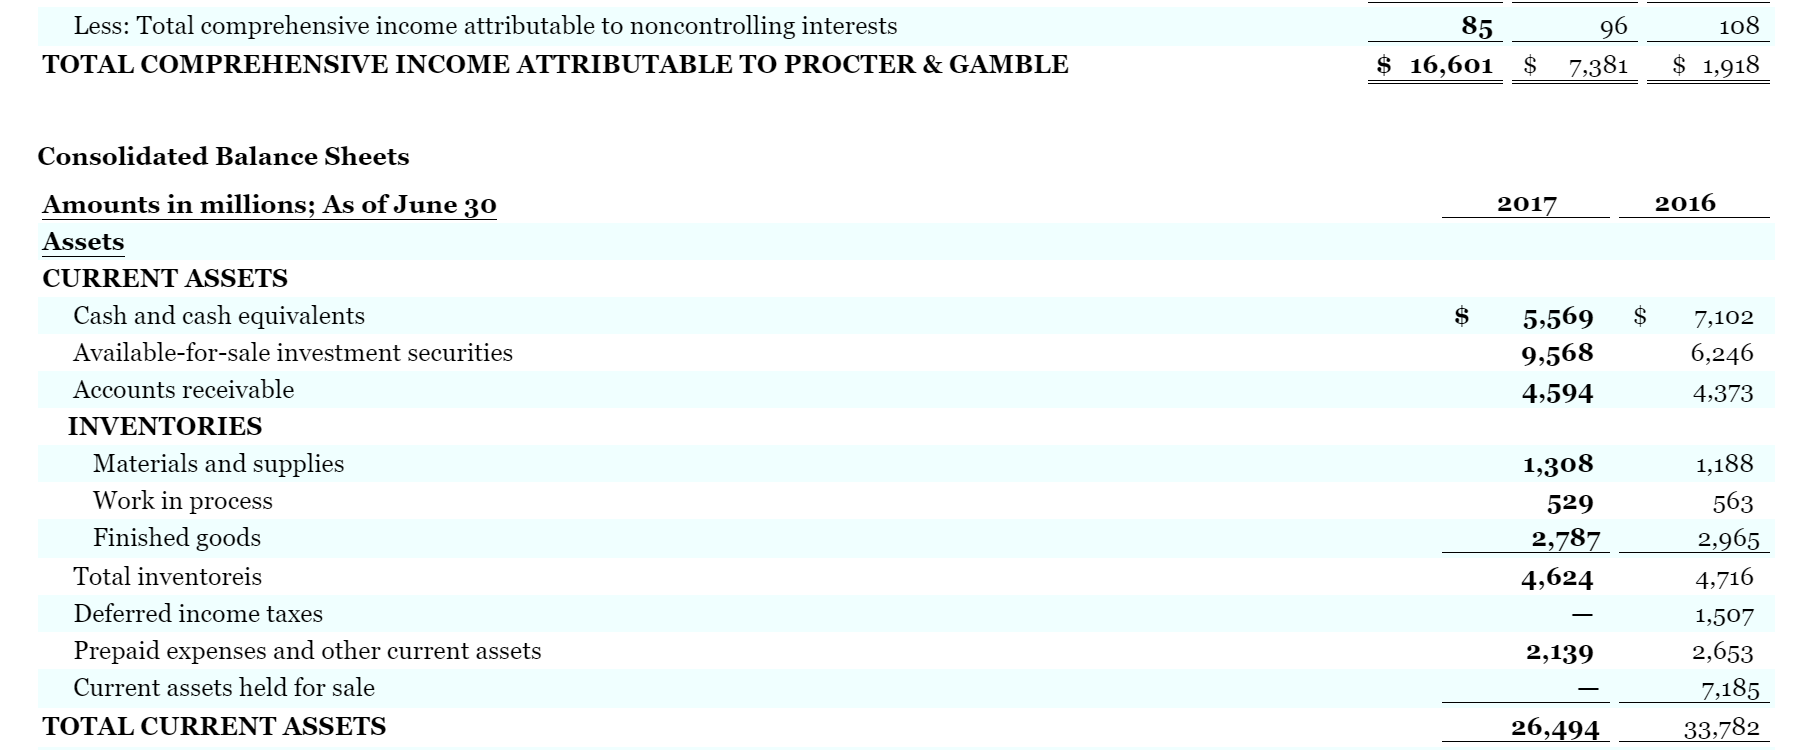
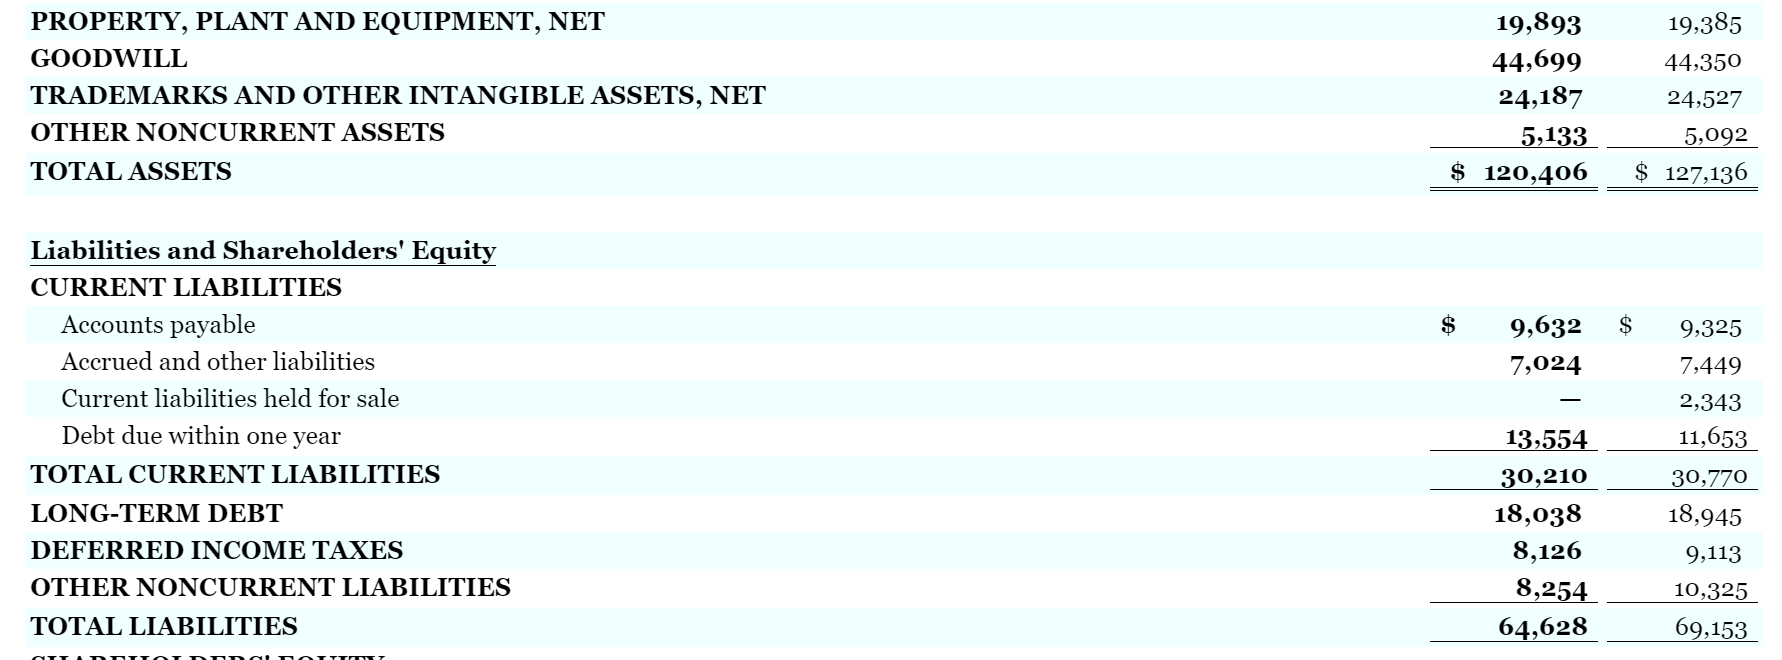
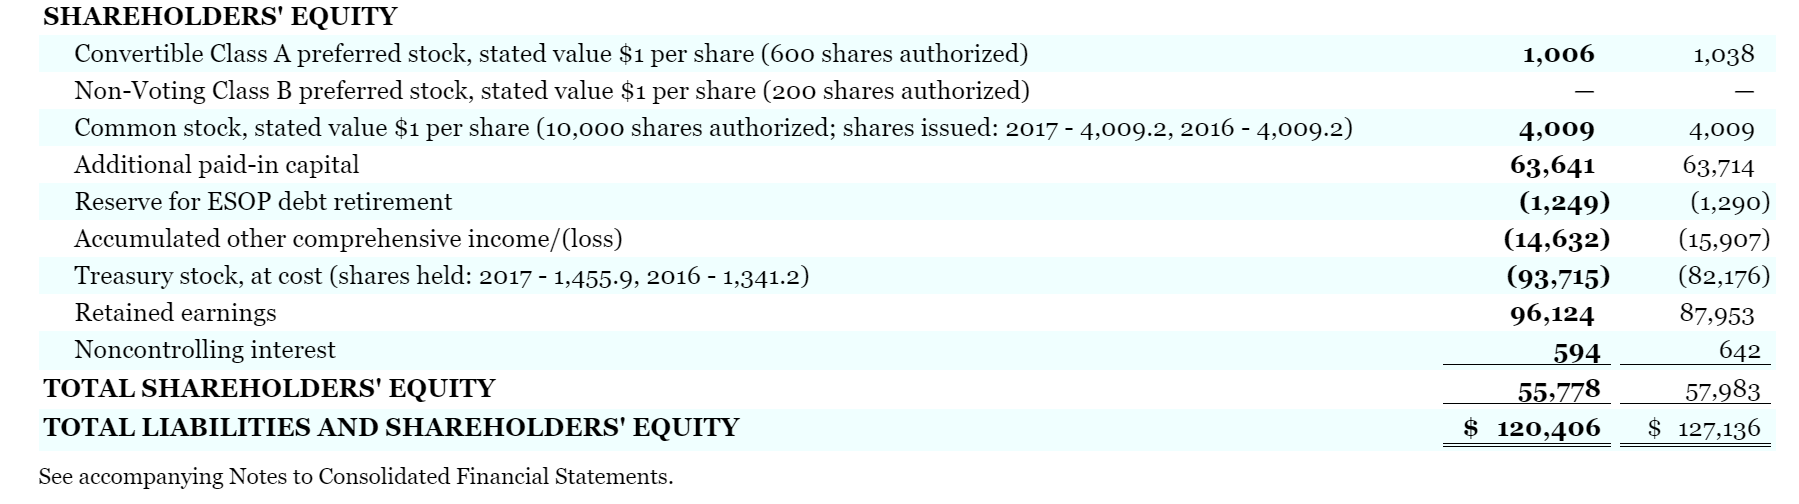
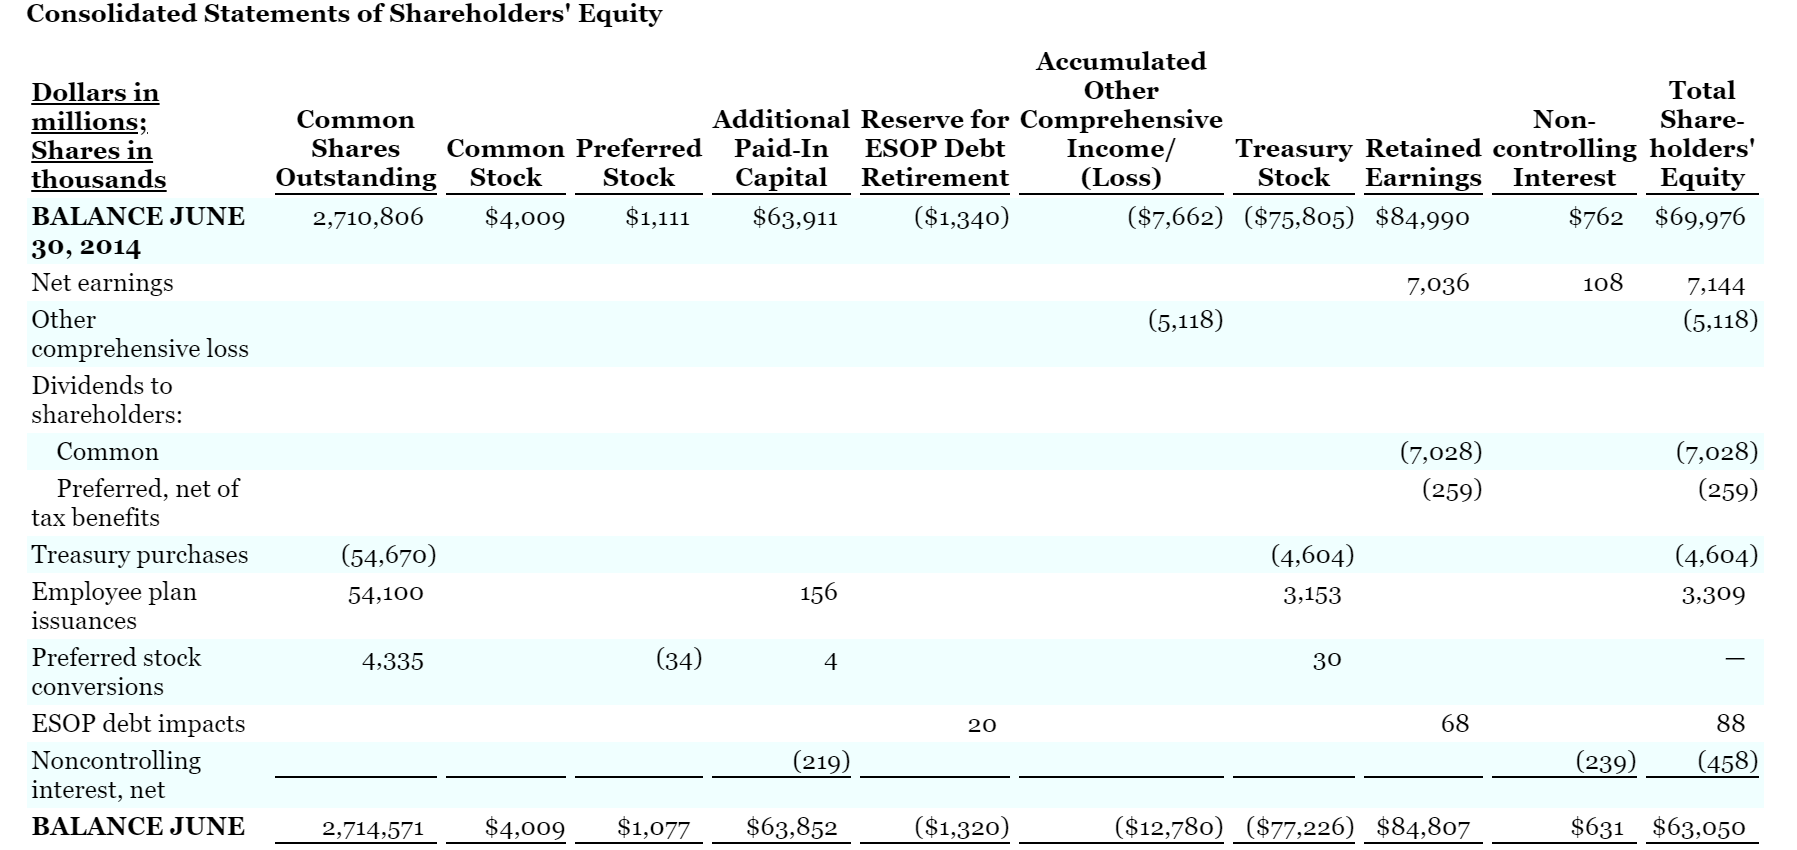
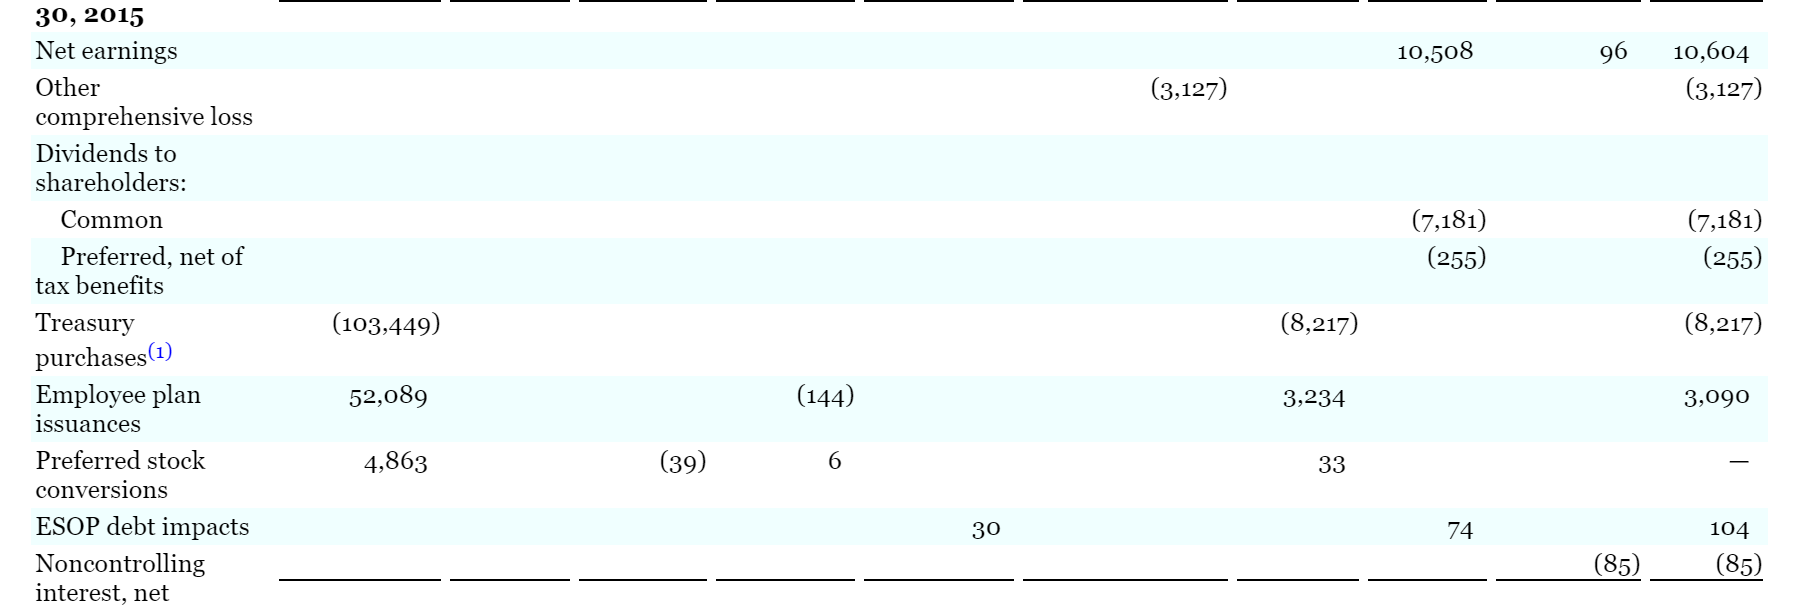
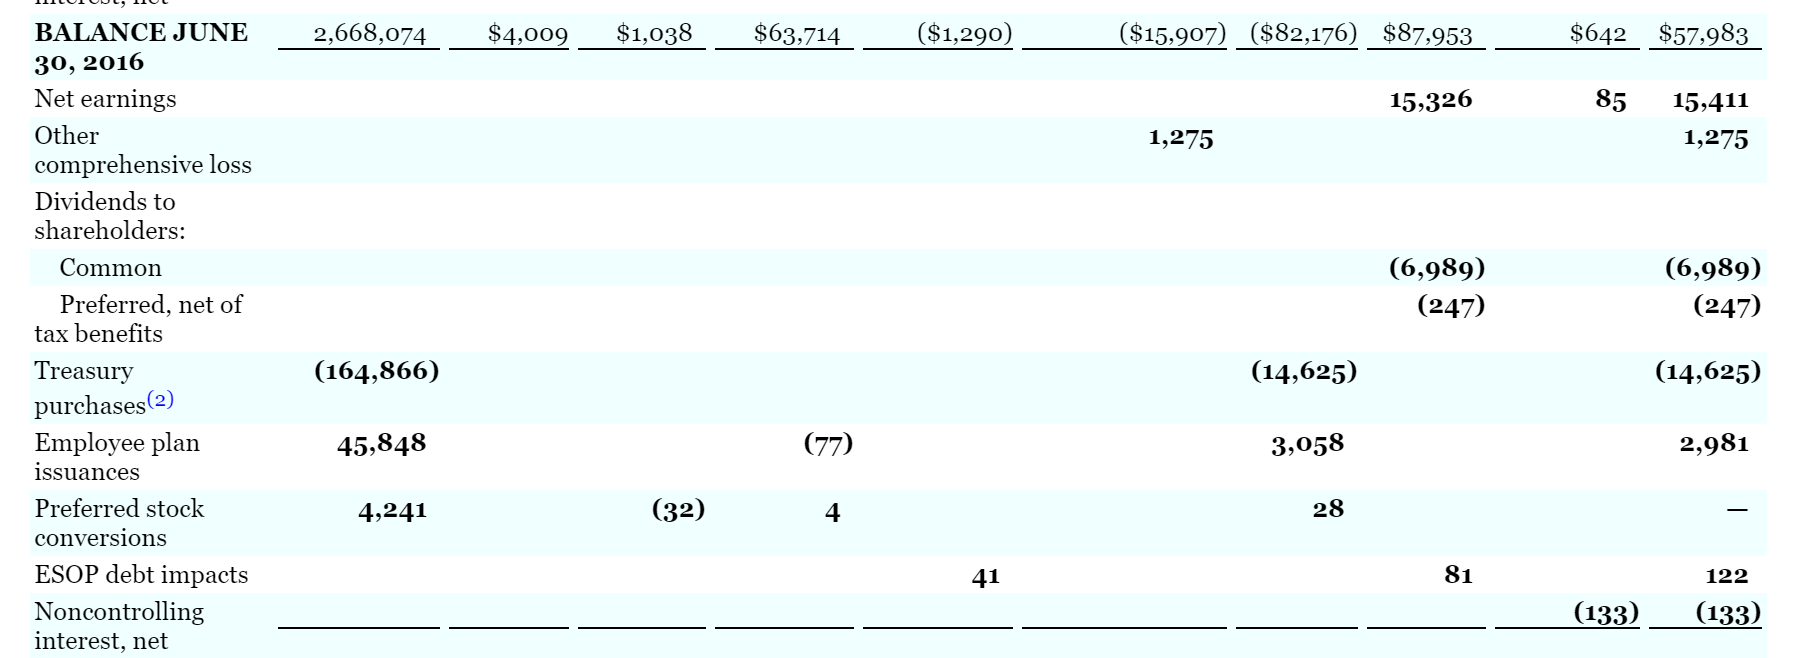
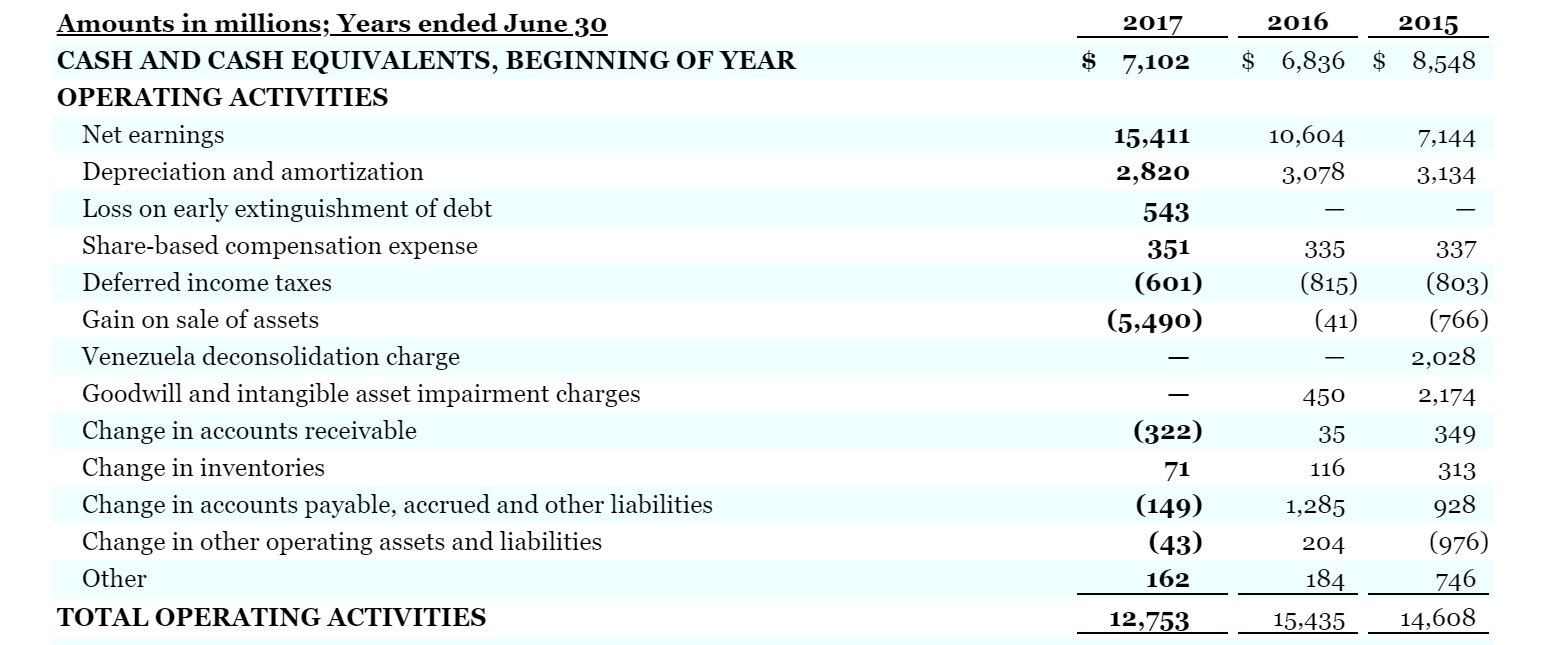
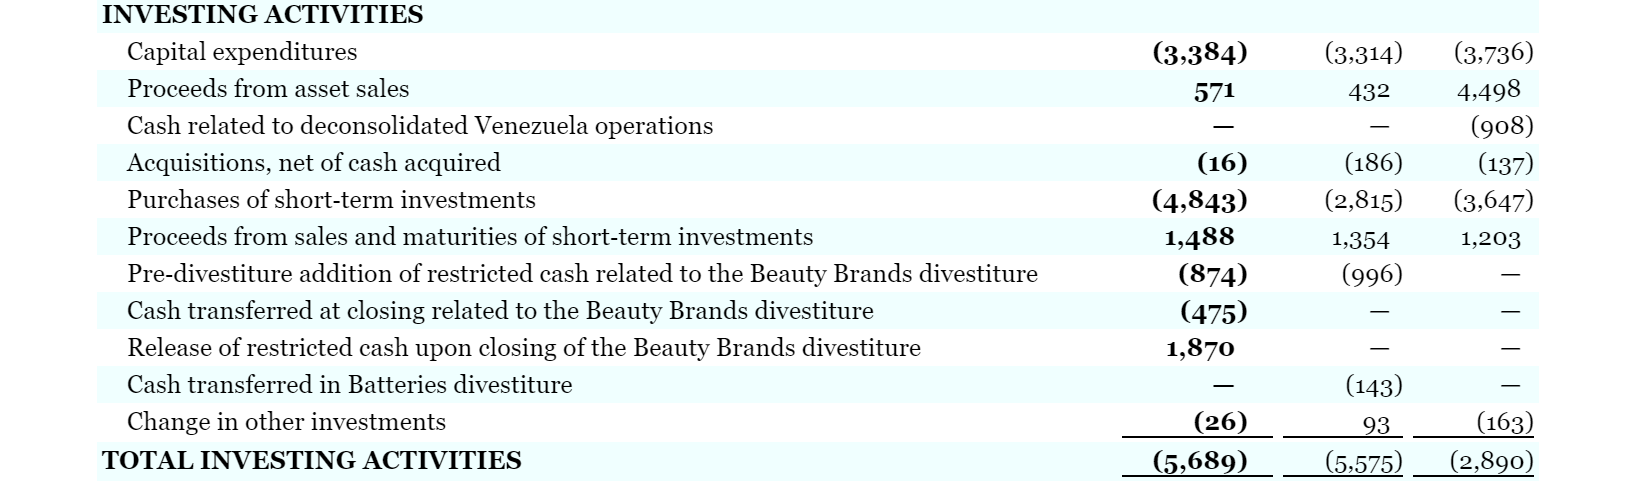
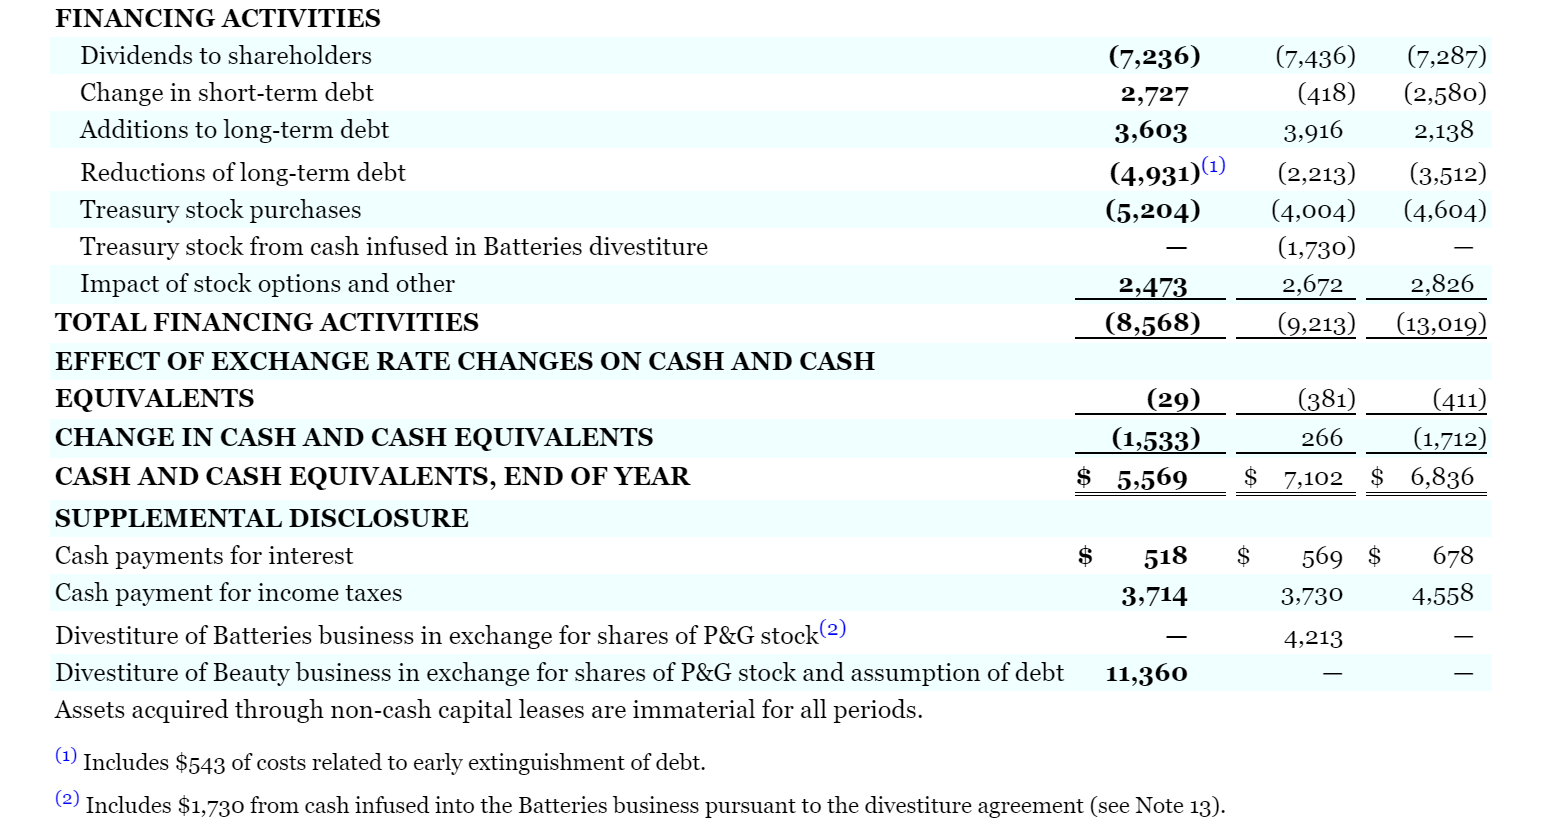
2015 $ 70,749 2017 $ 65,058 32,535 18,568 2016 $ 65,299 32,909 18,949 37,056 20,616 2,028 13,441 11,049 626 Consolidated Statements of Earnings Amounts in millions except per share amounts; Years ended June 30 NET SALES Cost of products sold Selling, general and administrative expense Venezuela deconsolidation charge OPERATING INCOME Interest expense Interest income Other non-operating income/(expense), net EARNINGS FROM CONTINUING OPERATIONS BEFORE INCOME TAXES Income taxes on continuing operations NET EARNINGS FROM CONTINUING OPERATIONS NET EARNINGS/(LOSS) FROM DISCONTINUED OPERATIONS NET EARNINGS Less: Net earnings attributable to noncontrolling interests NET EARNINGS ATTRIBUTABLE TO PROCTER & GAMBLE 579 182 149 440 325 13,369 11,012 13,955 465 171 (404) 13,257 3,063 10,194 5,217 15,411 85 $ 15,326 3,342 10,027 2,725 8,287 (1,143) 577 10,604 96 $ 10,508 7,144 108 $ 7,036 CA 3.79 $ 3.59 $ 2.92 (0.42) 2.01 0.21 $ 5.80 $ 3.80 $ 2.50 BASIC NET EARNINGS PER COMMON SHARE:(1) Earnings from continuing operations Earnings/(loss) from discontinued operations BASIC NET EARNINGS PER COMMON SHARE DILUTED NET EARNINGS PER COMMON SHARE:(1) Earnings from continuing operations Earnings/(loss) from discontinued operations DILUTED NET EARNINGS PER COMMON SHARE $ $ 3.49 $ 3.69 1.90 5.59 2.84 (0.40) 0.20 $ $ 3.69 $ 2.44 DIVIDENDS PER COMMON SHARE $ 2.70 $ 2.66 $ 2.59 (1) Basic net earnings per common share and Diluted net earnings per common share are calculated on Net earnings attributable to Procter & Gamble. 96 108 Less: Total comprehensive income attributable to noncontrolling interests TOTAL COMPREHENSIVE INCOME ATTRIBUTABLE TO PROCTER & GAMBLE 85 $ 16,601 $ 7,381 $ 1,918 Consolidated Balance Sheets 2017 2016 $ $ 5,569 9,568 4,594 7,102 6,246 4,373 Amounts in millions; As of June 30 Assets CURRENT ASSETS Cash and cash equivalents Available-for-sale investment securities Accounts receivable INVENTORIES Materials and supplies Work in process Finished goods Total inventoreis Deferred income taxes Prepaid expenses and other current assets Current assets held for sale TOTAL CURRENT ASSETS 1,308 529 2,787 4,624 1,188 563 2,965 4,716 1,507 2,653 7,185 33,782 2,139 26,494 PROPERTY, PLANT AND EQUIPMENT, NET GOODWILL TRADEMARKS AND OTHER INTANGIBLE ASSETS, NET OTHER NONCURRENT ASSETS 19,893 44,699 24,187 5,133 $ 120,406 19,385 44,350 24,527 5,092 $ 127,136 TOTAL ASSETS $ $ 9,632 7,024 Liabilities and Shareholders' Equity CURRENT LIABILITIES Accounts payable Accrued and other liabilities Current liabilities held for sale Debt due within one year TOTAL CURRENT LIABILITIES LONG-TERM DEBT DEFERRED INCOME TAXES OTHER NONCURRENT LIABILITIES TOTAL LIABILITIES 13,554 30,210 18,038 8,126 8,254 64,628 9,325 7,449 2,343 11,653 30,770 18,945 9,113 10,325 69,153 1,006 1,038 SHAREHOLDERS' EQUITY Convertible Class A preferred stock, stated value $1 per share (600 shares authorized) Non-Voting Class B preferred stock, stated value $1 per share (200 shares authorized) Common stock, stated value $1 per share (10,000 shares authorized; shares issued: 2017 - 4,009.2, 2016 - 4,009.2) Additional paid-in capital Reserve for ESOP debt retirement Accumulated other comprehensive income/(loss) Treasury stock, at cost (shares held: 2017 - 1,455.9, 2016 - 1,341.2) Retained earnings Noncontrolling interest TOTAL SHAREHOLDERS' EQUITY TOTAL LIABILITIES AND SHAREHOLDERS' EQUITY 4,009 63,641 (1,249) (14,632) (93,715) 96,124 594 55,778 $ 120,406 4,009 63,714 (1,290) (15,907) (82,176) 87,953 642 57,983 $ 127,136 See accompanying Notes to Consolidated Financial Statements. Consolidated Statements of Shareholders' Equity Accumulated Dollars in Other Total millions; Common Additional Reserve for Comprehensive Non- Share- Shares in Shares Common Preferred Paid-In ESOP Debt Income/ Treasury Retained controlling holders' thousands Outstanding Stock Stock Capital Retirement (Loss) Stock Earnings Interest Equity BALANCE JUNE 2,710,806 $4,009 $1,111 $63,911 ($1,340) ($7,662) ($75,805) $84,990 $762 $69,976 30, 2014 Net earnings 7,036 108 7,144 Other (5,118) (5,118) comprehensive loss Dividends to shareholders: Common (7,028) (7,028) Preferred, net of (259) (259) tax benefits Treasury purchases (54,670) (4,604) (4,604) Employee plan 54,100 3,153 3,309 issuances Preferred stock 4,335 (34) 4 30 conversions ESOP debt impacts 20 68 88 Noncontrolling (219) (239) (458) interest, net BALANCE JUNE 2,714,571 $4,009 $1,077 $63,852 ($1,320) ($12,780) ($77,226) $84,807 $631 $63,050 156 10,508 96 10,604 (3,127) (3,127) (7,181) (255) (7,181) (255) 30, 2015 Net earnings Other comprehensive loss Dividends to shareholders: Common Preferred, net of tax benefits Treasury purchases (1) Employee plan issuances Preferred stock conversions ESOP debt impacts Noncontrolling interest, net (103,449) (8,217) (8,217) 52,089 (144) 3,234 3,090 4,863 (39) 6 33 30 74 104 (85) (85) 2,668,074 $4,009 $1,038 $63,714 ($1,290) ($15,907) ($82,176) $87,953 $642 $57,983 15,326 85 15,411 1,275 1,275 (6,989) (247) (6,989) (247) BALANCE JUNE 30, 2016 Net earnings Other comprehensive loss Dividends to shareholders: Common Preferred, net of tax benefits Treasury purchases(2) Employee plan issuances Preferred stock conversions ESOP debt impacts Noncontrolling interest, net (164,866) (14,625) (14,625) 45,848 (77) 3,058 2,981 4,241 (32) 4 28 41 81 122 (133) (133) (1) Includes $4,213 of treasury shares acquired in the divestiture of the Batteries business (see Note 13). (2) Includes $9,421 of treasury shares received as part of the share exchange in the Beauty Brands transaction (see Note 13). See accompanying Notes to Consolidated Financial Statements. Consolidated Statements of Cash Flows 2017 $ 7,102 2016 2015 $ 6,836 $ 8,548 7,144 10,604 3,078 3,134 Amounts in millions; Years ended June 30 CASH AND CASH EQUIVALENTS, BEGINNING OF YEAR OPERATING ACTIVITIES Net earnings Depreciation and amortization Loss on early extinguishment of debt Share-based compensation expense Deferred income taxes Gain on sale of assets Venezuela deconsolidation charge Goodwill and intangible asset impairment charges Change in accounts receivable Change in inventories Change in accounts payable, accrued and other liabilities Change in other operating assets and liabilities Other 15,411 2,820 543 351 (601) (5,490) 335 (815) (41) 337 (803) (766) 2,028 450 2,174 35 116 (322) 71 (149) (43) 162 1,285 349 313 928 (976) 746 14,608 204 184 15,435 TOTAL OPERATING ACTIVITIES 12,753 (3,314) (3,384) 571 432 INVESTING ACTIVITIES Capital expenditures Proceeds from asset sales Cash related to deconsolidated Venezuela operations Acquisitions, net of cash acquired Purchases of short-term investments Proceeds from sales and maturities of short-term investments Pre-divestiture addition of restricted cash related to the Beauty Brands divestiture Cash transferred at closing related to the Beauty Brands divestiture Release of restricted cash upon closing of the Beauty Brands divestiture Cash transferred in Batteries divestiture Change in other investments TOTAL INVESTING ACTIVITIES (3,736) 4,498 (908) (137) (3,647) 1,203 (16) (4,843) 1,488 (874) (475) 1,870 (186) (2,815) 1,354 (996) (143) 93 (26) (5,689) (163) (2,890) (5,575) FINANCING ACTIVITIES Dividends to shareholders (7,236) (7,436) (7,287) Change in short-term debt 2,727 (418) (2,580) Additions to long-term debt 3,603 3,916 2,138 Reductions of long-term debt (4,931)(1) (2,213) (3,512) Treasury stock purchases (5,204) (4,004) (4,604) Treasury stock from cash infused in Batteries divestiture (1,730) Impact of stock options and other 2,473 2,672 2,826 TOTAL FINANCING ACTIVITIES (8,568) (9,213) (13,019) EFFECT OF EXCHANGE RATE CHANGES ON CASH AND CASH EQUIVALENTS (29) (381) (411) CHANGE IN CASH AND CASH EQUIVALENTS (1,533) 266 (1,712) CASH AND CASH EQUIVALENTS, END OF YEAR $ 5,569 $ 7,102 $ 6,836 SUPPLEMENTAL DISCLOSURE Cash payments for interest $ $ 569 $ Cash payment for income taxes 3,714 3,730 Divestiture of Batteries business in exchange for shares of P&G stock(2) 4,213 Divestiture of Beauty business in exchange for shares of P&G stock and assumption of debt 11,360 Assets acquired through non-cash capital leases are immaterial for all periods. (1) Includes $543 of costs related to early extinguishment of debt. (2) Includes $1,730 from cash infused into the Batteries business pursuant to the divestiture agreement (see Note 13). 518 678 4,558