

Answered step by step
Verified Expert Solution
Question
1 Approved Answer
what are the answers? Excel Analytics 05-02 (Static) Cost-Volume-Profit Relationships [L05-1, LO5-2, L05-3, L05-4, LO5-5, LO5-7, LO5-9] Lyndia Company is a merchandiser that sells a
what are the answers? 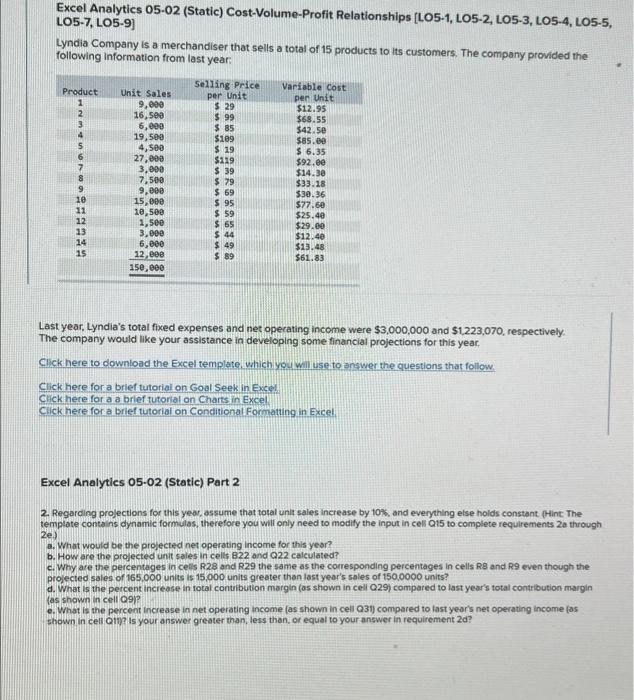
Excel Analytics 05-02 (Static) Cost-Volume-Profit Relationships [L05-1, LO5-2, L05-3, L05-4, LO5-5, LO5-7, LO5-9] Lyndia Company is a merchandiser that sells a total of 15 products to its customers. The company provided the following information from last year: Last year, Lyndia's total fixed expenses and net operating income were $3,000,000 and $1,223,070, respectively. The company would like your assistance in developing some financial projections for this year. Click here to download the Excel template, which you will use to answer the questions that follow. Click here for a brief tutorial on Soal Seek in Excel Click here for a a brief tutorial on Charts in Excel. Click here for a brief tutorial on Conditional Formatung in Excel. Excel Analytics 05.02 (Static) Part 2 2. Regarding projections for this year, ossume that total unit sales increase by tok, and everything else holds constant, (Hint The template contains dynamic formulas, therefore you will only need to modity the input in cell Qis to complete requirements 2e through 2e.) a. What would be the projected net operating income for this year? b. How are the projected unit sales in cells 822 and Q22 calculated? c. Why are the percentages in cels R28 and R29 the same as the corresponding percentages in cells R8 and R9 even though the projected sales of 165.000 units is 15,000 units greater than last year's sales of 150.0000 units? d. What is the percent increose in total contibution margin (as shown in cell Q29) compared to last year's total contribution margin (as shown in cell 09? 1. What is the percent increase in net operating income (as shown in cell Q3i) compared to last year's net operating income (os shown in cell Qily? is your answer greater than, less then, or equal to your answer in requirement 2d ? Excel Analytics 05-02 (Static) Cost-Volume-Profit Relationships [L05-1, LO5-2, L05-3, L05-4, LO5-5, LO5-7, LO5-9] Lyndia Company is a merchandiser that sells a total of 15 products to its customers. The company provided the following information from last year: Last year, Lyndia's total fixed expenses and net operating income were $3,000,000 and $1,223,070, respectively. The company would like your assistance in developing some financial projections for this year. Click here to download the Excel template, which you will use to answer the questions that follow. Click here for a brief tutorial on Soal Seek in Excel Click here for a a brief tutorial on Charts in Excel. Click here for a brief tutorial on Conditional Formatung in Excel. Excel Analytics 05.02 (Static) Part 2 2. Regarding projections for this year, ossume that total unit sales increase by tok, and everything else holds constant, (Hint The template contains dynamic formulas, therefore you will only need to modity the input in cell Qis to complete requirements 2e through 2e.) a. What would be the projected net operating income for this year? b. How are the projected unit sales in cells 822 and Q22 calculated? c. Why are the percentages in cels R28 and R29 the same as the corresponding percentages in cells R8 and R9 even though the projected sales of 165.000 units is 15,000 units greater than last year's sales of 150.0000 units? d. What is the percent increose in total contibution margin (as shown in cell Q29) compared to last year's total contribution margin (as shown in cell 09? 1. What is the percent increase in net operating income (as shown in cell Q3i) compared to last year's net operating income (os shown in cell Qily? is your answer greater than, less then, or equal to your answer in requirement 2d Step by Step Solution
There are 3 Steps involved in it
Step: 1

Get Instant Access to Expert-Tailored Solutions
See step-by-step solutions with expert insights and AI powered tools for academic success
Step: 2

Step: 3
Ace Your Homework with AI
Get the answers you need in no time with our AI-driven, step-by-step assistance
Get Started
Audit Analysis Part 1 Facts Of Auditing
Authors: Dr. L. KAILASAM
1st Edition
1670149455, 978-1670149459