

Answered step by step
Verified Expert Solution
Question
1 Approved Answer
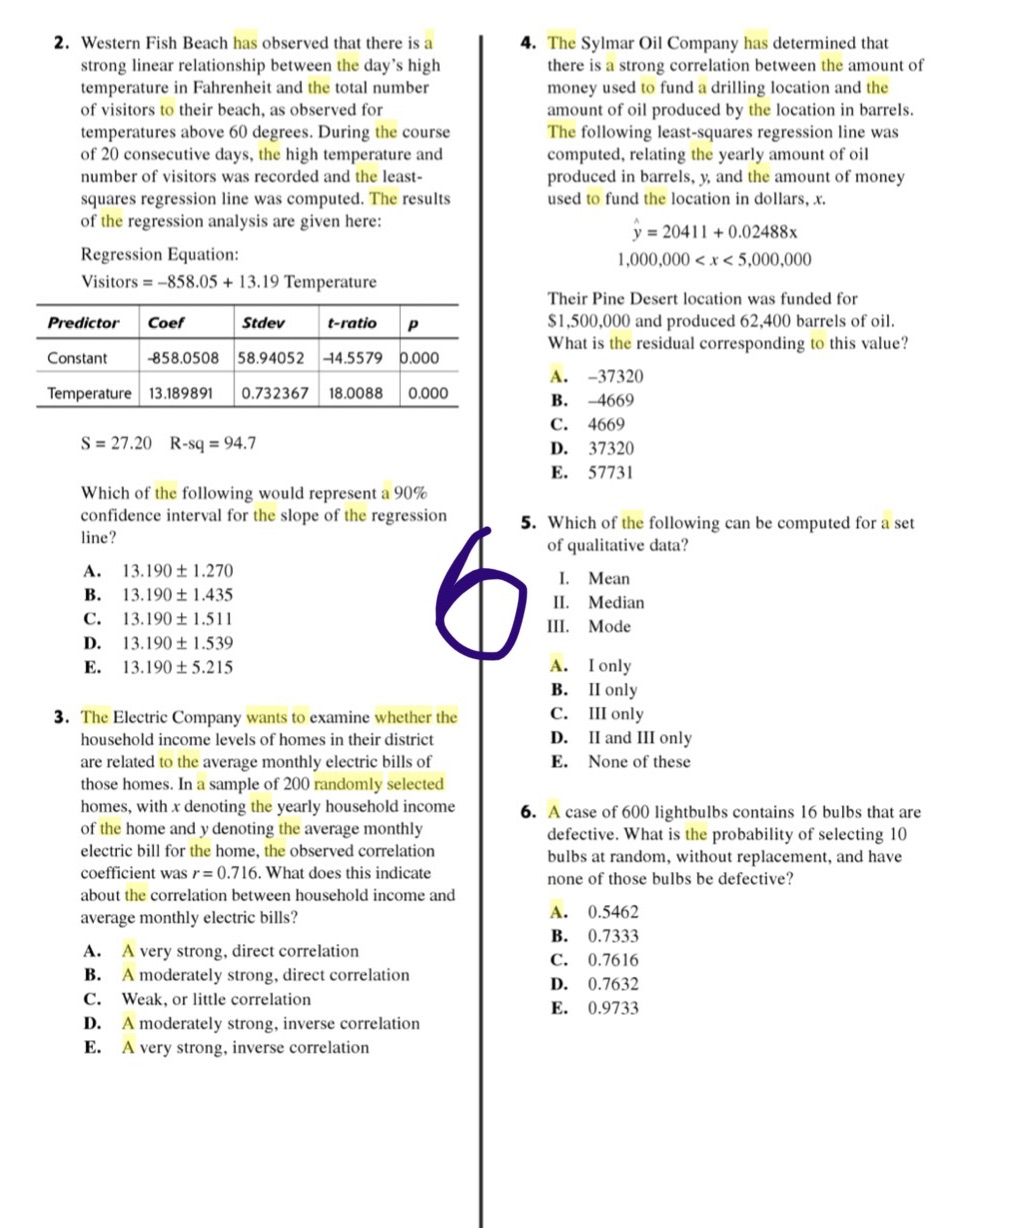
What are the answers for the problems below? please give me explanations as well. please ignore the random line or number. thank you. this is
What are the answers for the problems below? please give me explanations as well. please ignore the random line or number. thank you. this is from cliff ap statistics book
Step by Step Solution
There are 3 Steps involved in it
Step: 1

Get Instant Access to Expert-Tailored Solutions
See step-by-step solutions with expert insights and AI powered tools for academic success
Step: 2

Step: 3
Ace Your Homework with AI
Get the answers you need in no time with our AI-driven, step-by-step assistance
Get Started
Mathematical Applications For The Management, Life And Social Sciences
Authors: Ronald J. Harshbarger, James J. Reynolds
12th Edition
978-1337625340