Answered step by step
Verified Expert Solution
Link Copied!

Question

1 Approved Answer

What are the excel formulas on how to for the data table??? J K L M N $2,881,622 $1,183,216 $1,208,161 $1,233,343 $1,258,742 $1,340,551 0.08x 7.3%

What are the excel formulas on how to for the data table???
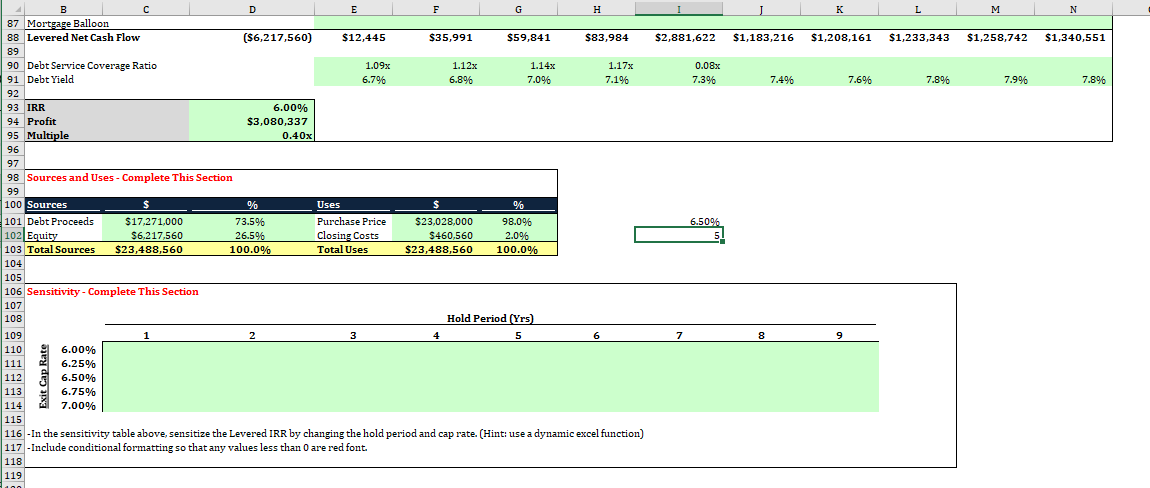
image text in transcribed

J K L M N $2,881,622 $1,183,216 $1,208,161 $1,233,343 $1,258,742 $1,340,551 0.08x 7.3% 7.4% 7.6% 7.8% 7.9% 7.8% 6.50% B D E F G H 87 Mortgage Balloon 88 Levered Net Cash Flow ($6,217,560) $12,445 $35,991 $59,841 $83,984 89 90 Debt Service Coverage Ratio 1.09x 1.12x 1.14x 1.17x 91 Debt Yield 6.7% 6.8% 7.0% 7.196 92 93 IRR 6.00% 94 Profit $3,080,337 95 Multiple 0.40x 96 97 98 Sources and Uses - Complete This Section 99 100 Sources $ 0% Uses $ % 101 Debt Proceeds $17.271.000 73.5% Purchase Price $23,028,000 98.0% 102 Equity $6,217,560 26.5% Closing Costs $460,560 2.0% 103 Total Sources $23,488,560 100.0% Total Uses $23,488,560 100.0% 104 105 106 Sensitivity - Complete This Section 107 108 Hold Period (Yrs) 109 1 2 3 5 6 110 6.00% 111 6.25% 112 56.50% 113 6.75% 114 7.00% 115 116 - In the sensitivity table above, sensitize the Levered IRR by changing the hold period and cap rate. (Hint: use a dynamic excel function) 117 - Include conditional formatting so that any values less than 0 are red font. 118 119 inn 7 8 9 Exit Cap Rate J K L M N $2,881,622 $1,183,216 $1,208,161 $1,233,343 $1,258,742 $1,340,551 0.08x 7.3% 7.4% 7.6% 7.8% 7.9% 7.8% 6.50% B D E F G H 87 Mortgage Balloon 88 Levered Net Cash Flow ($6,217,560) $12,445 $35,991 $59,841 $83,984 89 90 Debt Service Coverage Ratio 1.09x 1.12x 1.14x 1.17x 91 Debt Yield 6.7% 6.8% 7.0% 7.196 92 93 IRR 6.00% 94 Profit $3,080,337 95 Multiple 0.40x 96 97 98 Sources and Uses - Complete This Section 99 100 Sources $ 0% Uses $ % 101 Debt Proceeds $17.271.000 73.5% Purchase Price $23,028,000 98.0% 102 Equity $6,217,560 26.5% Closing Costs $460,560 2.0% 103 Total Sources $23,488,560 100.0% Total Uses $23,488,560 100.0% 104 105 106 Sensitivity - Complete This Section 107 108 Hold Period (Yrs) 109 1 2 3 5 6 110 6.00% 111 6.25% 112 56.50% 113 6.75% 114 7.00% 115 116 - In the sensitivity table above, sensitize the Levered IRR by changing the hold period and cap rate. (Hint: use a dynamic excel function) 117 - Include conditional formatting so that any values less than 0 are red font. 118 119 inn 7 8 9 Exit Cap Rate

Step by Step Solution

There are 3 Steps involved in it

Step: 1

blur-text-image

Get Instant Access to Expert-Tailored Solutions

See step-by-step solutions with expert insights and AI powered tools for academic success

Step: 2

blur-text-image

Step: 3

blur-text-image

Ace Your Homework with AI

Get the answers you need in no time with our AI-driven, step-by-step assistance

Get Started

Recommended Textbook for

Beyond Greed And Fear Understanding Behavioral Finance And The Psychology Of Investing

Authors: Hersh Shefrin

1st Edition

0195161211, 978-0195161212

More Books

Students also viewed these Finance questions

Question

What other visualizations might you use to explore sales revenue?

Answered: 1 week ago