Answered step by step
Verified Expert Solution
Question
1 Approved Answer
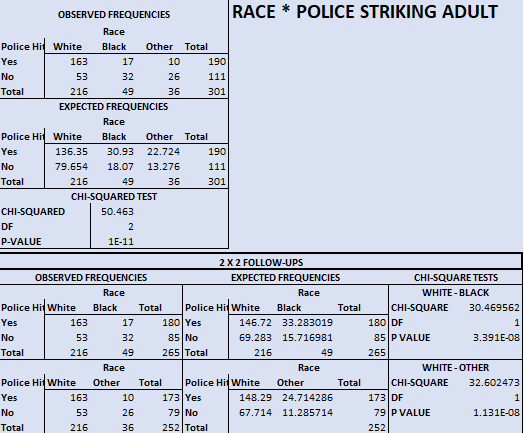
What are the key findings of this data? What are the implications of this chi-square analysis? Can you explain the findings using simple-to-explain statistical values
What are the key findings of this data? What are the implications of this chi-square analysis? Can you explain the findings using simple-to-explain statistical values such as percentages? Are the results statistically significant? Can you provide an example of how to display this information in at least two graphs?

Step by Step Solution
There are 3 Steps involved in it
Step: 1

Get Instant Access to Expert-Tailored Solutions
See step-by-step solutions with expert insights and AI powered tools for academic success
Step: 2

Step: 3

Ace Your Homework with AI
Get the answers you need in no time with our AI-driven, step-by-step assistance
Get Started


