Answered step by step
Verified Expert Solution
Link Copied!

Question

1 Approved Answer

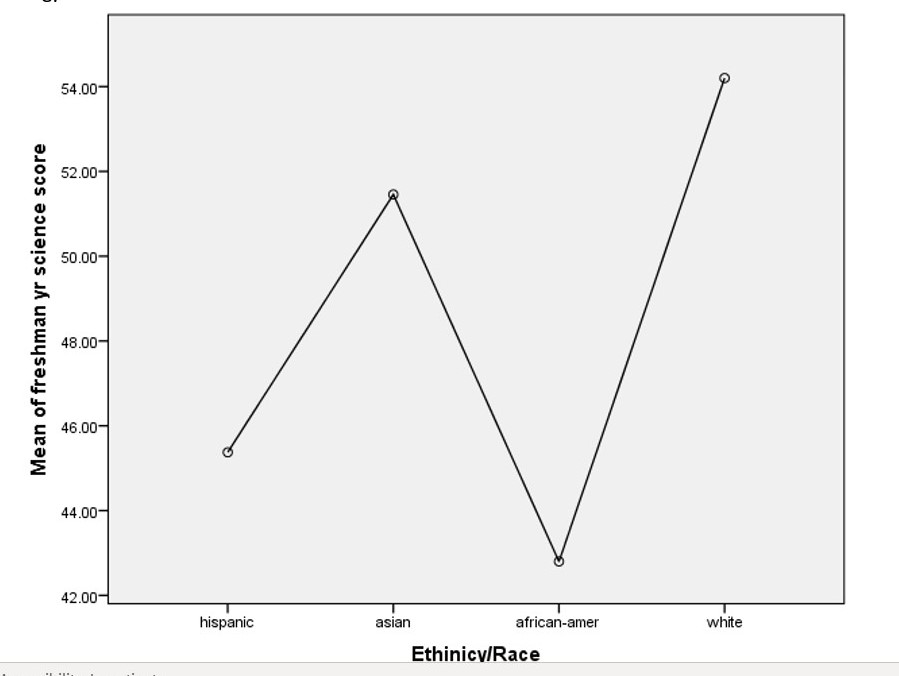
What are the null and alternative hypotheses for this analysis? describe the descriptive data for each ethnicity/race group (include N, mean, standard deviation, minimum, &

What are the null and alternative hypotheses for this analysis?

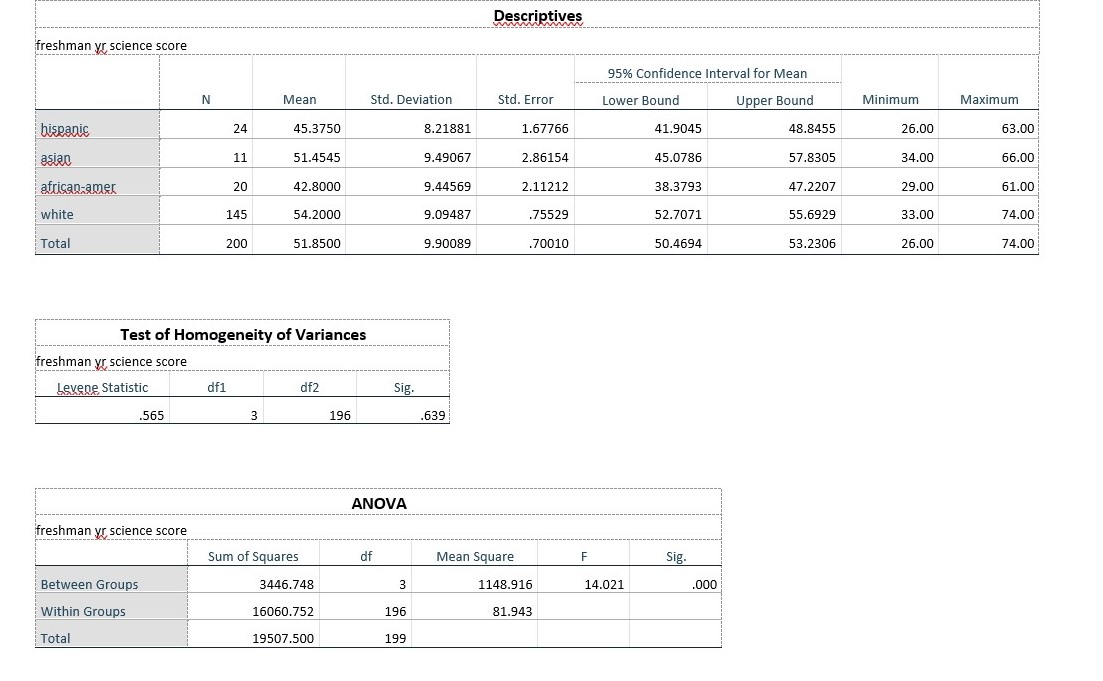
describe the descriptive data for each ethnicity/race group (include N, mean, standard deviation, minimum, & maximum).

Did we violate the assumption of homogeneity in this analysis? Include evidence for your answer, how do you know?

Were there significant differences in science scores between the different ethnicities?

Based on the results of the analysis, should you analyze the post hoc tests?

If yes, which groups are significantly different from each other? (List all).

what does the post hoc tests tell us about the relationship between ethnicity and science scores.

Complete Step 4 of hypothesis testing. Include your decision about the null hypothesis, a sentence describing the results (including post hoc tests), and the APA string of statistics.

what is the relationship between ethnicity and science scores?

Descriptives
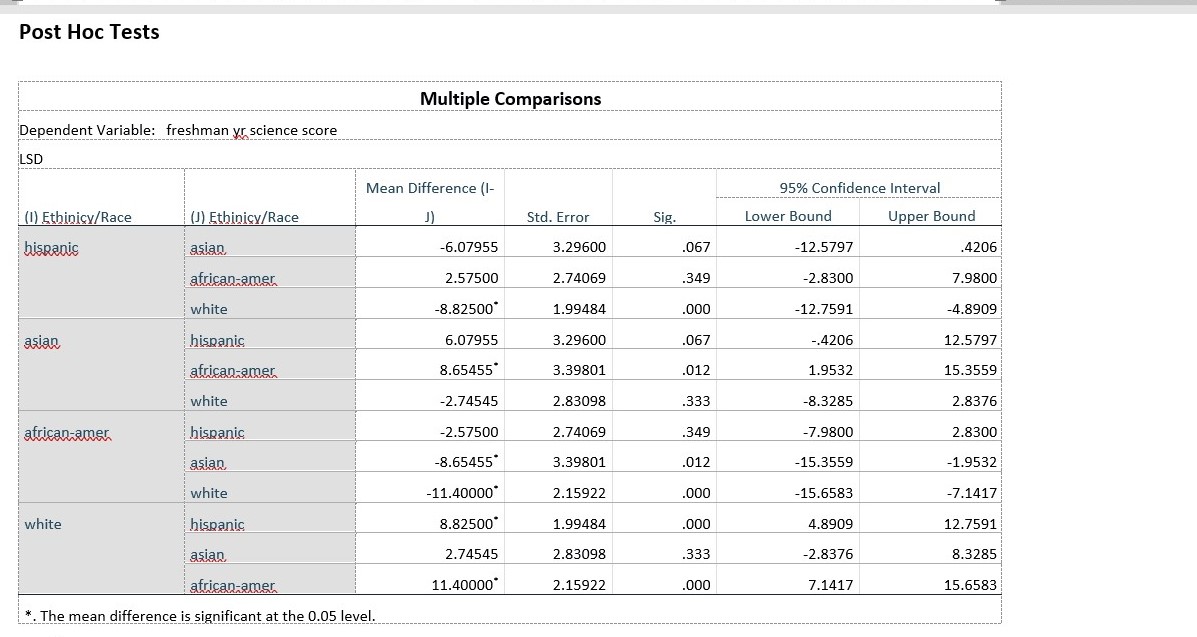
image text in transcribedimage text in transcribedimage text in transcribed
Post Hoc Tests Multiple Comparisons Dependent Variable: freshman yr science score LSD Mean Difference (1- 95% Confidence Interval (1) Ethinicy/Race (J) Ethinicy/Race Std. Error Sig. Lower Bound Upper Bound hispanic asian, -6.07955 3.29600 067 -12.5797 4206 african-amer 2.57500 2.74069 .349 -2.8300 7.9800 white -8.82500" 1.99484 .000 -12.7591 -4.8909 asian hispanic 6.07955 3.29600 067 -.4206 12.5797 african-amer 8.65455" 3.39801 .012 1.9532 15.3559 : white -2.74545 2.83098 .333 -8.3285 2.8376 african-amer hispanic -2.57500 2.74069 349 -7.9800 2.8300 asian -8.65455 3.39801 012 15.3559 -1.9532 white -11.40000" 2.15922 .000 -15.6583 -7.1417 white hispanic 8.82500" 1.99484 000 4.8909 12.7591 asian 2.74545 2.83098 333 -2.8376 8.3285 african-amer 11.40000 2.15922 000 7.1417 15.6583 *. The mean difference is significant at the 0.05 level.54.00- 52.00- 50.00- Mean of freshman yr science score 48.00- 46.00- 44.00- 42.00- hispanic asian african-amer white Ethinicy/RaceDescriptives WWW freshman yr science score 95% Confidence Interval for Mean N Mean Std. Deviation Std. Error Lower Bound Upper Bound Minimum Maximum hispanic 24 45.3750 8.21881 1.67766 41.9045 48.8455 26.00 63.00 asian 11 51.4545 9.49067 2.86154 45.0786 57.8305 34.00 66.00 african-amer 20 42.8000 9.44569 2.11212 38.3793 47.2207 29.00 61.00 white 145 54.2000 9.09487 .75529 52.7071 55.6929 33.00 74.00 Total 200 51.8500 9.90089 .70010 50.4694 53.2306 26.00 74.00 Test of Homogeneity of Variances freshman yr science score Levene Statistic df1 df2 Sig. .565 3 196 639 ANOVA freshman yr science score Sum of Squares df Mean Square F Sig. Between Groups 3446.748 3 1148.916 14.021 000 Within Groups 16060.752 196 81.943 Total 19507.500 199

Step by Step Solution

There are 3 Steps involved in it

Step: 1

blur-text-image

Get Instant Access to Expert-Tailored Solutions

See step-by-step solutions with expert insights and AI powered tools for academic success

Step: 2

blur-text-image

Step: 3

blur-text-image

Ace Your Homework with AI

Get the answers you need in no time with our AI-driven, step-by-step assistance

Get Started

Recommended Textbook for

Probability and Random Processes With Applications to Signal Processing and Communications

Authors: Scott Miller, Donald Childers

2nd edition

123869811, 978-0121726515, 121726517, 978-0130200716, 978-0123869814

More Books

Students also viewed these Mathematics questions