

Question: What are the resistance and support levels? What do support and resistance levels mean for the stock price? Look at this stock price chart for
What are the resistance and support levels? What do support and resistance levels mean for the stock price? Look at this stock price chart for MCD.
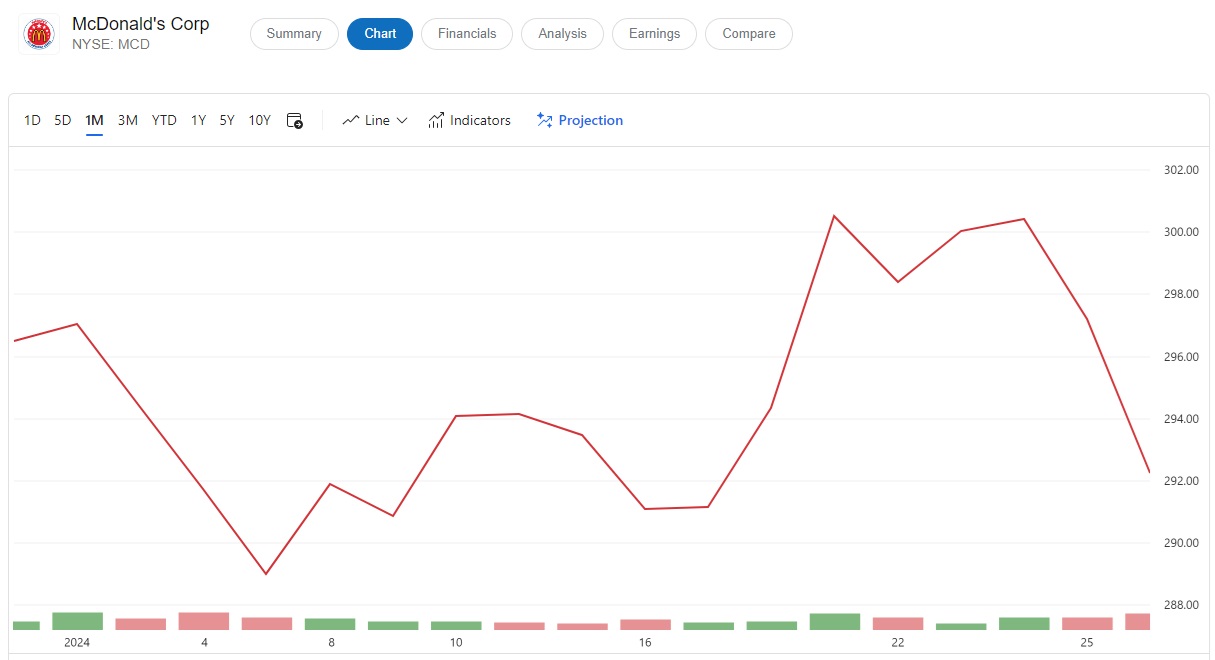
McDonald's Corp m Summary Chart Financials Analysis Earnings Compare NYSE: MCD 1D 5D 1M 3M YTD 1Y 5Y 10Y Line v Indicators Projection 2024 8 10 16 22 25 302.00 300.00 298.00 296.00 294.00 292.00 290.00 288.00
Step by Step Solution
There are 3 Steps involved in it
1 Expert Approved Answer
Step: 1 Unlock

Question Has Been Solved by an Expert!
Get step-by-step solutions from verified subject matter experts
Step: 2 Unlock
Step: 3 Unlock