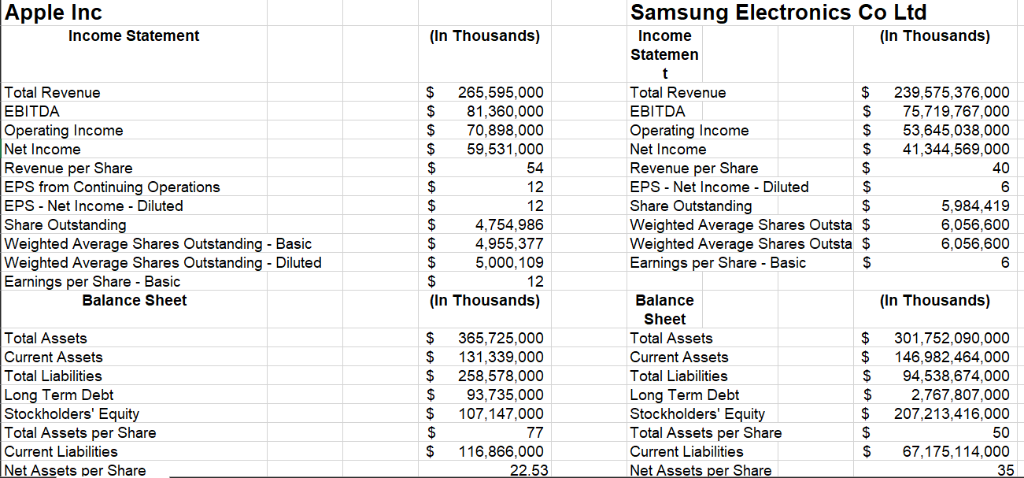
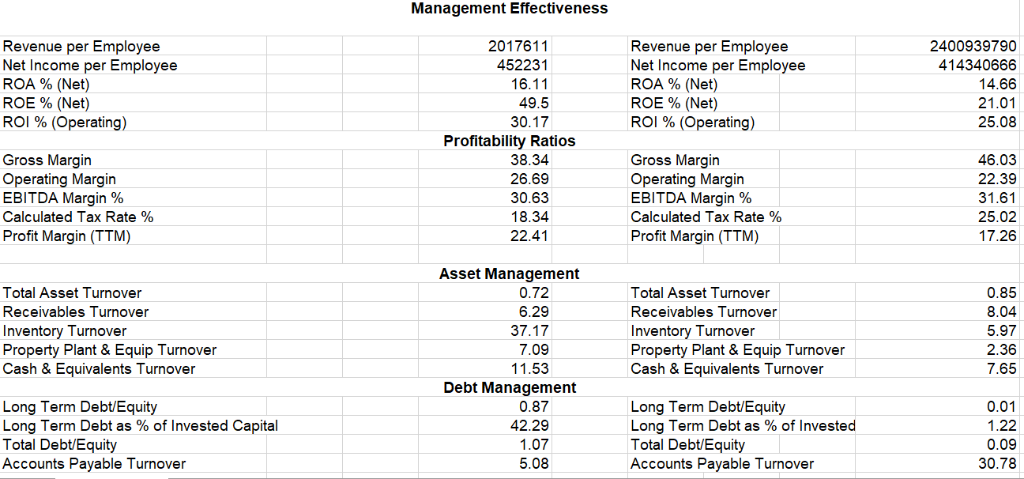
What can you say about Apples financial performance? Compare Apple with key competitor.
Apple is on the left hand side on each picture and Samsung on the right. If you can touch on each section that will be greatly appreciated. Thank you


Apple Indc Samsung Electronics Co Ltd Income Statement (In Thousands) (In Thousands) Income Statemen Total Revenue EBITDA Operating Income Net Income Revenue per Share EPS from Continuing Operations EPS - Net Income Diluted Share Outstanding Weighted Average Shares Outstanding - Basic Weighted Average Shares Outstanding - Diluted Earnings per Share - Basic Total Revenue EBITDA Operating Income Net Income Revenue per Share EPS - Net Income Diluted Share Outstanding Weighted Average Shares Outsta $ Weighted Average Shares Outsta $ Earnings per Share- Basic $ 239,575,376,000 $75,719,767,000 $ 53,645,038,000 $ 41,344,569,000 40 $ 265,595,000 $ 81,360,000 $70,898,000 $59,531,000 54 12 12 $4,754,986 $4,955,377 5.000,109 12 (In Thousands) 5,984,419 6,056,600 6,056,600 Balance Sheet Balance (In Thousands) Total Assets Current Assets Total Liabilities Long Term Debt Stockholders' Equity Total Assets per Share Current Liabilities Net Assets per Share $ 365,725,000 $ 131,339,000 $ 258,578,000 $93,735,000 $ 107,147,000 Sheet Total Assets Current Assets Total Liabilities Long Term Debt Stockholders' Equity Total Assets per Share Current Liabilities $ 301,752,090,000 $ 146,982,464,000 $94,538,674,000 $2,767,807,000 $ 207,213,416,000 50 $ 116,866,000 $ 67,175,114,000 Stock Price and Valuation (Data as of 03/01/2019) Market Cap(mil) Share Outstanding(000's) PE Ratio Dividend Per Share(TTM) Earning Per Share(TTM) Last Closing Price Previous Trading Day Range 52 Week Range 7 Day Average Closing Price 30 Day Average Closing Price 200 Day Average Closing Price Beta High Price Last 3 Mos Low Price Last 3 Mos Avg Daily Volume Last 3 Mos 825033 4715280 14.3772 2.92 12.27 174.97 172.89 - 175.15 142.19-232.07 174.09 171.34 191.03 0.89 184.82 142.19 37039164.75 Share Outstanding(000's) Dividend Per Share(TTM) Last Closing Price Previous Trading Day Range 52 Week Range 7 Day Average Closing Price 30 Day Average Closing Price 200 Day Average Closing Price 7449599 1.7019 88.5 88.42 88.50 79.00 145.21 88.5 88.25 91.59 Management Effectiveness Revenue per Employee Net Income per Employee ROA % (Net) ROE % (Net) ROI % (Operating) 2017611 452231 16.11 49.5 30.17 Revenue per Employee Net Income per Employee ROA % (Net) ROE % (Net) ROI % (Operating) 2400939790 414340666 14.66 21.01 25.08 Profitability Ratios Gross Margin Operating Margin EBITDA Margin % Calculated Tax Rate % Profit Margin (TTM) 38.34 26.69 30.63 18.34 22.41 Gross Margin Operating Margin EBITDA Margin % Calculated Tax Rate % Profit Margin (TTM) 46.03 22.39 31.61 25.02 17.26 Asset Management Total Asset Turnover Receivables Turnover nventory Turnover Property Plant & Equip Turnover Cash & Equivalents Turnover 0.72 6.29 37.17 7.09 11.53 Total Asset Turnover Receivables Turnover Inventory Turnover Property Plant& Equip Turnover Cash & Equivalents Turnover 0.85 8.04 5.97 2.36 7.65 Debt Management Long Term Debt/Equity Long Term Debt as % of Invested Capital Total Debt/Equity Accounts Payable Turnover 0.87 42.29 1.07 5.08 Long Term Debt/Equity Long Term Debt as % of Invested Total Debt/Equity Accounts Payable Turnover 0.01 1.22 0.09 30.78 Apple Indc Samsung Electronics Co Ltd Income Statement (In Thousands) (In Thousands) Income Statemen Total Revenue EBITDA Operating Income Net Income Revenue per Share EPS from Continuing Operations EPS - Net Income Diluted Share Outstanding Weighted Average Shares Outstanding - Basic Weighted Average Shares Outstanding - Diluted Earnings per Share - Basic Total Revenue EBITDA Operating Income Net Income Revenue per Share EPS - Net Income Diluted Share Outstanding Weighted Average Shares Outsta $ Weighted Average Shares Outsta $ Earnings per Share- Basic $ 239,575,376,000 $75,719,767,000 $ 53,645,038,000 $ 41,344,569,000 40 $ 265,595,000 $ 81,360,000 $70,898,000 $59,531,000 54 12 12 $4,754,986 $4,955,377 5.000,109 12 (In Thousands) 5,984,419 6,056,600 6,056,600 Balance Sheet Balance (In Thousands) Total Assets Current Assets Total Liabilities Long Term Debt Stockholders' Equity Total Assets per Share Current Liabilities Net Assets per Share $ 365,725,000 $ 131,339,000 $ 258,578,000 $93,735,000 $ 107,147,000 Sheet Total Assets Current Assets Total Liabilities Long Term Debt Stockholders' Equity Total Assets per Share Current Liabilities $ 301,752,090,000 $ 146,982,464,000 $94,538,674,000 $2,767,807,000 $ 207,213,416,000 50 $ 116,866,000 $ 67,175,114,000 Stock Price and Valuation (Data as of 03/01/2019) Market Cap(mil) Share Outstanding(000's) PE Ratio Dividend Per Share(TTM) Earning Per Share(TTM) Last Closing Price Previous Trading Day Range 52 Week Range 7 Day Average Closing Price 30 Day Average Closing Price 200 Day Average Closing Price Beta High Price Last 3 Mos Low Price Last 3 Mos Avg Daily Volume Last 3 Mos 825033 4715280 14.3772 2.92 12.27 174.97 172.89 - 175.15 142.19-232.07 174.09 171.34 191.03 0.89 184.82 142.19 37039164.75 Share Outstanding(000's) Dividend Per Share(TTM) Last Closing Price Previous Trading Day Range 52 Week Range 7 Day Average Closing Price 30 Day Average Closing Price 200 Day Average Closing Price 7449599 1.7019 88.5 88.42 88.50 79.00 145.21 88.5 88.25 91.59 Management Effectiveness Revenue per Employee Net Income per Employee ROA % (Net) ROE % (Net) ROI % (Operating) 2017611 452231 16.11 49.5 30.17 Revenue per Employee Net Income per Employee ROA % (Net) ROE % (Net) ROI % (Operating) 2400939790 414340666 14.66 21.01 25.08 Profitability Ratios Gross Margin Operating Margin EBITDA Margin % Calculated Tax Rate % Profit Margin (TTM) 38.34 26.69 30.63 18.34 22.41 Gross Margin Operating Margin EBITDA Margin % Calculated Tax Rate % Profit Margin (TTM) 46.03 22.39 31.61 25.02 17.26 Asset Management Total Asset Turnover Receivables Turnover nventory Turnover Property Plant & Equip Turnover Cash & Equivalents Turnover 0.72 6.29 37.17 7.09 11.53 Total Asset Turnover Receivables Turnover Inventory Turnover Property Plant& Equip Turnover Cash & Equivalents Turnover 0.85 8.04 5.97 2.36 7.65 Debt Management Long Term Debt/Equity Long Term Debt as % of Invested Capital Total Debt/Equity Accounts Payable Turnover 0.87 42.29 1.07 5.08 Long Term Debt/Equity Long Term Debt as % of Invested Total Debt/Equity Accounts Payable Turnover 0.01 1.22 0.09 30.78


