Answered step by step
Verified Expert Solution
Question
1 Approved Answer
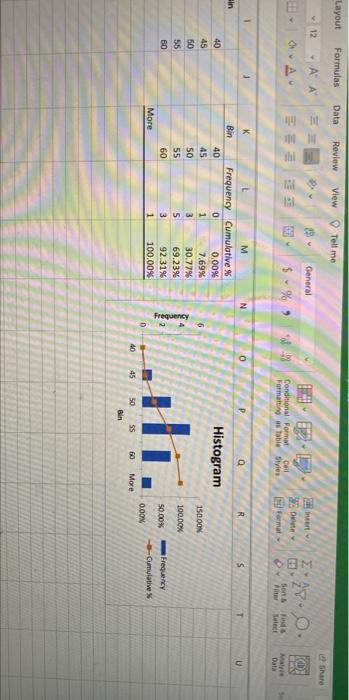
what conclusion i can make about stocks of EBIx looking at the histogram. Calibri (Body) v 12 ' DO > ab > till Paste BI
what conclusion i can make about stocks of EBIx looking at the histogram. 

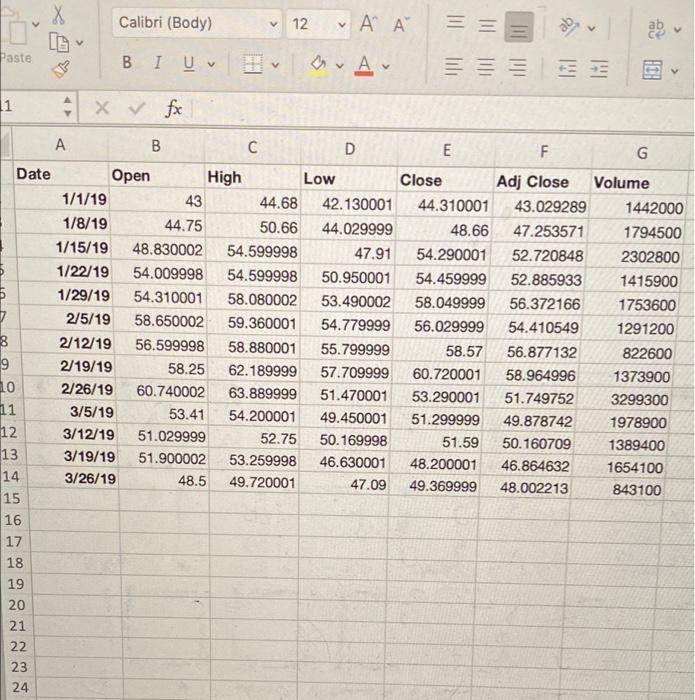
Calibri (Body) v 12 ' DO > ab > till Paste BI U v a v Av V ===== HOH 11 - XV fx A B D E F G 09 ago Date Open High Low Close Adj Close Volume 1/1/19 43 44.68 42.130001 44.310001 43.029289 1442000 1/8/19 44.75 50.66 44.029999 48.66 47.253571 1794500 1/15/19 48.830002 54.599998 47.91 54.290001 52.720848 2302800 1/22/19 54.009998 54.599998 50.950001 54.459999 52.885933 1415900 6 1/29/19 54.310001 58.080002 53.490002 58.049999 56.372166 1753600 1 2/5/19 58.650002 59.360001 54.779999 56.029999 54.410549 1291200 3 2/12/19 56.599998 58.880001 55.799999 58.57 56.877132 822600 9 2/19/19 58.25 62.189999 57.709999 60.720001 58.964996 1373900 10 2/26/19 60.740002 63.889999 51.470001 53.290001 51.749752 3299300 11 3/5/19 53.41 54.200001 49.450001 51.299999 49.878742 1978900 12 3/12/19 51.029999 52.75 50.169998 51.59 50.160709 1389400 13 3/19/19 51.900002 53.259998 46.630001 48.200001 46.864632 1654100 14 3/26/19 48.5 49.720001 47.09 49.369999 48.002213 843100 15 16 17 18 19 20 21 22 23 24 th NNN Layout Formulas Data Review View Tell me Share 12 - A A 15 General OA 27.0 s .% 9 OEM Conditional Format Carl Formatting Table Styles Sorts Filter Format LMS Mai Data ud Sulec 1 K N 0 Q R $ T U Sin Bin 0.00% Histogram 40 45 50 55 60 15000N M Frequency Cumulative % 0 1 7.69% 3 30.77% 5 69.23% 3 92.31% 1 100.00% 40 45 50 55 60 100.00% Frequency 2 50.00% Frequency --Cumulative More 0 0.OON 40 45 55 60 More 50 Bin Calibri (Body) v 12 ' DO > ab > till Paste BI U v a v Av V ===== HOH 11 - XV fx A B D E F G 09 ago Date Open High Low Close Adj Close Volume 1/1/19 43 44.68 42.130001 44.310001 43.029289 1442000 1/8/19 44.75 50.66 44.029999 48.66 47.253571 1794500 1/15/19 48.830002 54.599998 47.91 54.290001 52.720848 2302800 1/22/19 54.009998 54.599998 50.950001 54.459999 52.885933 1415900 6 1/29/19 54.310001 58.080002 53.490002 58.049999 56.372166 1753600 1 2/5/19 58.650002 59.360001 54.779999 56.029999 54.410549 1291200 3 2/12/19 56.599998 58.880001 55.799999 58.57 56.877132 822600 9 2/19/19 58.25 62.189999 57.709999 60.720001 58.964996 1373900 10 2/26/19 60.740002 63.889999 51.470001 53.290001 51.749752 3299300 11 3/5/19 53.41 54.200001 49.450001 51.299999 49.878742 1978900 12 3/12/19 51.029999 52.75 50.169998 51.59 50.160709 1389400 13 3/19/19 51.900002 53.259998 46.630001 48.200001 46.864632 1654100 14 3/26/19 48.5 49.720001 47.09 49.369999 48.002213 843100 15 16 17 18 19 20 21 22 23 24 th NNN Layout Formulas Data Review View Tell me Share 12 - A A 15 General OA 27.0 s .% 9 OEM Conditional Format Carl Formatting Table Styles Sorts Filter Format LMS Mai Data ud Sulec 1 K N 0 Q R $ T U Sin Bin 0.00% Histogram 40 45 50 55 60 15000N M Frequency Cumulative % 0 1 7.69% 3 30.77% 5 69.23% 3 92.31% 1 100.00% 40 45 50 55 60 100.00% Frequency 2 50.00% Frequency --Cumulative More 0 0.OON 40 45 55 60 More 50 Bin 

Step by Step Solution
There are 3 Steps involved in it
Step: 1

Get Instant Access to Expert-Tailored Solutions
See step-by-step solutions with expert insights and AI powered tools for academic success
Step: 2

Step: 3

Ace Your Homework with AI
Get the answers you need in no time with our AI-driven, step-by-step assistance
Get Started


