Answered step by step
Verified Expert Solution
Question
1 Approved Answer
what decisin should i make to help improve my company Name Pimno Size MTBF Perceptual Map (at end of this year) 20 18 Able A_Bag
what decisin should i make to help improve my company 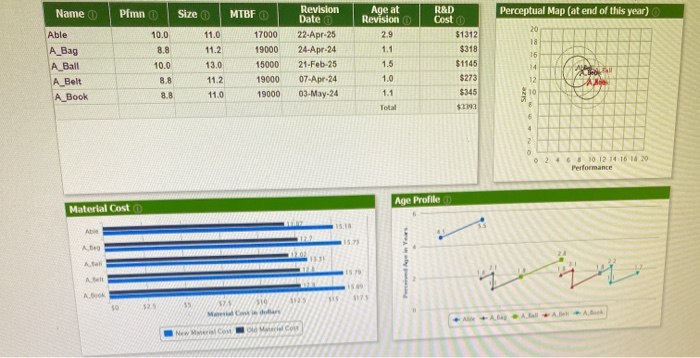
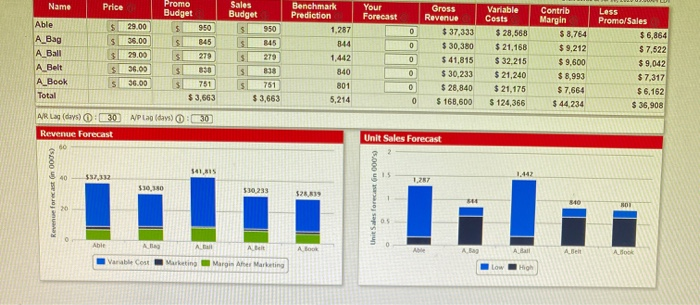
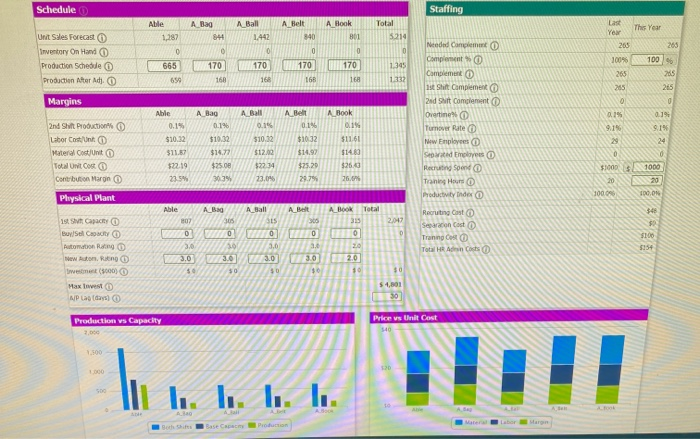
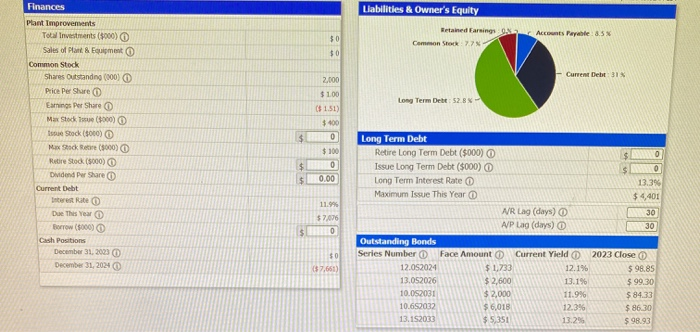
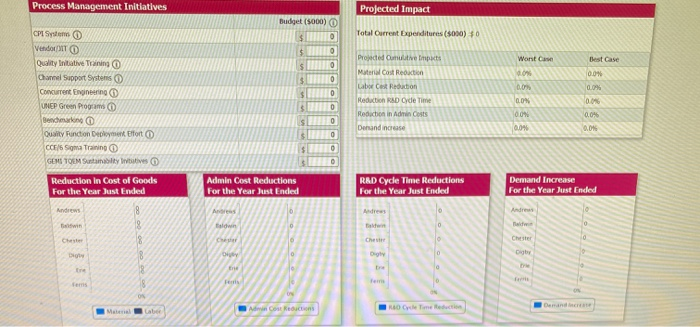
Name Pimno Size MTBF Perceptual Map (at end of this year) 20 18 Able A_Bag A_Ball A_Belt A_Book 10.0 8.8 10.0 8.8 8.8 11.0 11.2 13.0 11.2 11.0 15 Revision Date 22-Apr-25 24-Apr-24 21-Feb-25 07-Apr-24 03-May-24 Age at Revision 2.9 1.1 1.5 17000 19000 15000 19000 19000 R&D Costo $1312 $318 $1145 $273 $345 $7193 14 1.0 12 Size 1.1 Total 10 8 6 4 2 26 10 12 14 16 18 20 Performance Age Profile Material Cost 115.75 A Atan 2 A 125 50 325 55 17 Maadu AAAAA Cou New Cou Name Price Sales Budget s Your Forecast $ 29.00 0 950 845 0 Able A Bag A_Ball A Belt A Book Total $ $ 36.00 29.00 36.00 Promo Budget 950 845 279 $ s $ 3.663 Benchmark Prediction 1,287 8-44 1,442 840 801 5,214 . 0 Gross Revenue $ 37,333 $ 30,380 $ 41,815 $ 30,233 $ 28,840 $ 168,600 279 838 $ s s Variable Costs $ 28,568 $ 21,168 $32.215 $ 21,240 $ 21,175 $ 124,366 Contrib Margin $ 3.764 $ 9,212 $ 9,600 $ 8,993 $ 7,664 $ 44,234 Less Promo/Sales $ 6,864 $7.522 $9.042 $ 7,317 $ 6,162 $ 36,908 $ .... 0 5 36.00 0 751 $3,663 0 AR LA 30 Aplag days) 0:30 Revenue Forecast Unit Sales Forecast 541,815 40 $32,312 1.442 1,267 530,150 Revenue forecast on 000's) 530.233 $28.619 Unit des forecast On 000 20 Able Ata A Belt A Book A Bag A Ball Abell Alook Variable Cont Marketing Margin Aer Marketing Low High Schedule Staffing Alle Last A Bag 841 A Belt 840 A Hook 801 A Ball 1.442 0 Total 5214 This Year Year 1,287 263 205 0 0 0 0 0 Unt Sales Forecast Inventory On Hand Production Schede Production liter Adj. 100 170 170 170 665 699 170 168 1345 1332 100% 265 285 168 168 168 255 215 Margins 0 019 A Bag 0.1% A Ball 0.14 A Belt 0.1% A Book 0.1% $1161 Needed Compleet Complemento Complement 1st Shift Complement 2nd Suit Complement Overtine 0 Tumover Rate New Employees Septed Employees Recruiting Soon Training Hours Productivity index 9.15 Able 0.14 $10.32 311.00 $2219 91% 2nd Shift Production Labor Costunt Material Count Total Unit Cost Contribution Marino 20 0 0 $10.32 $14.77 $25.00 3039 $10.32 $12.00 $2234 23.04 $10.32 $14.97 $25.29 29.7% $14.80 $26.40 26.6 $1000 1000 23.5 100.096 100,ON Physical Plant A BOOK Total 348 2,047 Recruiting Cast Separacion Cost Trflg G 0) D Able A_Bag A Ball A Belt 07 305 SIS WO TO TO 3.0 30 3.0 3.0 3.0 3.0 320 30 Se 50 30 $0 1ST SIVACY Buy/Selt Automation w Auton. Ring we (0) $ $100 $15+ 0 20 2.0 10 $0 Max Invest NP a days) $4,801 30 Production vs Capacity Price Us Unit Cost LI I!! I. Ii. I. Production Liabilities & Owner's Equity $0 Retained Earnings Common Stock Accounts Payable 8.5 $0 2.000 Current Debt 31 Long Term Debt: 52.8% Finances Plant Improvements Total Investments (3000) Sales of Plant & Equipment Common Stock Shares Outstanding (000) Price Per Share Earnings Per Share Max Stock (000) Is Stock (5000) Max Shock (5000) Retire Stock (5000) Dividend w Share Current Debt Interest Rate Due This Year Borrow (5000) Cash Positions December 31, 2023 O December 31, 2024 $ 100 $1.51) $400 $ 0 $ 100 $ 0 $ 0.00 11.9% $7,076 SO Long Term Debt Retire Long Term Debt ($000) O Issue Long Term Debt (5000) $ 0 Long Term Interest Rate 13.394 Maximum Issue This Year $4,401 MR Lag (days) 30 A/P Lag (days) 30 Outstanding Bonds Series Number Face Amount Current Yield 2023 Close 12.052024 $ 1,733 12.1% $ 98.85 13.052026 $ 2,600 13.1% $99.30 10.052031 $2,000 11.9% $ 84.33 10.652032 $ 6,018 12.3% $ 86.30 13.152033 $5,351 13.295 $98.93 $0 37,651) Process Management Initiatives Projected Impact Budget (5000) $ Total Current Expenditures (5000) $0 0 0 $ Worst Case Best Case o $ 0.0% 0 $ 0 CP Systems Vendo Quality Initiative Training Channel Support Systems Concurrent Engineering UNEP Green Program Benchmarkno Quality Function Deployment fort CCE/6 Sigma Training GENTOEM Samatytives Reduction in Cost of Goods For the Year Just Ended Andrews Projected Outive Impact Material Cost Reduction Labor Cost Rection Reduction RSD de Time Reduction in Admin Costs Dersand increase 0.0 0.0% 0.04 0.04 S 0 0.0 0 $ 0 Admin Cost Reductions For the Year Just Ended RAD Cycle Time Reductions For the Year Just Ended Demand Increase For the Year Just Ended A taldwin Chester Che 0 Chester DU 0 09 Admin Cost Recon Roche Tech Demand Malate Name Pimno Size MTBF Perceptual Map (at end of this year) 20 18 Able A_Bag A_Ball A_Belt A_Book 10.0 8.8 10.0 8.8 8.8 11.0 11.2 13.0 11.2 11.0 15 Revision Date 22-Apr-25 24-Apr-24 21-Feb-25 07-Apr-24 03-May-24 Age at Revision 2.9 1.1 1.5 17000 19000 15000 19000 19000 R&D Costo $1312 $318 $1145 $273 $345 $7193 14 1.0 12 Size 1.1 Total 10 8 6 4 2 26 10 12 14 16 18 20 Performance Age Profile Material Cost 115.75 A Atan 2 A 125 50 325 55 17 Maadu AAAAA Cou New Cou Name Price Sales Budget s Your Forecast $ 29.00 0 950 845 0 Able A Bag A_Ball A Belt A Book Total $ $ 36.00 29.00 36.00 Promo Budget 950 845 279 $ s $ 3.663 Benchmark Prediction 1,287 8-44 1,442 840 801 5,214 . 0 Gross Revenue $ 37,333 $ 30,380 $ 41,815 $ 30,233 $ 28,840 $ 168,600 279 838 $ s s Variable Costs $ 28,568 $ 21,168 $32.215 $ 21,240 $ 21,175 $ 124,366 Contrib Margin $ 3.764 $ 9,212 $ 9,600 $ 8,993 $ 7,664 $ 44,234 Less Promo/Sales $ 6,864 $7.522 $9.042 $ 7,317 $ 6,162 $ 36,908 $ .... 0 5 36.00 0 751 $3,663 0 AR LA 30 Aplag days) 0:30 Revenue Forecast Unit Sales Forecast 541,815 40 $32,312 1.442 1,267 530,150 Revenue forecast on 000's) 530.233 $28.619 Unit des forecast On 000 20 Able Ata A Belt A Book A Bag A Ball Abell Alook Variable Cont Marketing Margin Aer Marketing Low High Schedule Staffing Alle Last A Bag 841 A Belt 840 A Hook 801 A Ball 1.442 0 Total 5214 This Year Year 1,287 263 205 0 0 0 0 0 Unt Sales Forecast Inventory On Hand Production Schede Production liter Adj. 100 170 170 170 665 699 170 168 1345 1332 100% 265 285 168 168 168 255 215 Margins 0 019 A Bag 0.1% A Ball 0.14 A Belt 0.1% A Book 0.1% $1161 Needed Compleet Complemento Complement 1st Shift Complement 2nd Suit Complement Overtine 0 Tumover Rate New Employees Septed Employees Recruiting Soon Training Hours Productivity index 9.15 Able 0.14 $10.32 311.00 $2219 91% 2nd Shift Production Labor Costunt Material Count Total Unit Cost Contribution Marino 20 0 0 $10.32 $14.77 $25.00 3039 $10.32 $12.00 $2234 23.04 $10.32 $14.97 $25.29 29.7% $14.80 $26.40 26.6 $1000 1000 23.5 100.096 100,ON Physical Plant A BOOK Total 348 2,047 Recruiting Cast Separacion Cost Trflg G 0) D Able A_Bag A Ball A Belt 07 305 SIS WO TO TO 3.0 30 3.0 3.0 3.0 3.0 320 30 Se 50 30 $0 1ST SIVACY Buy/Selt Automation w Auton. Ring we (0) $ $100 $15+ 0 20 2.0 10 $0 Max Invest NP a days) $4,801 30 Production vs Capacity Price Us Unit Cost LI I!! I. Ii. I. Production Liabilities & Owner's Equity $0 Retained Earnings Common Stock Accounts Payable 8.5 $0 2.000 Current Debt 31 Long Term Debt: 52.8% Finances Plant Improvements Total Investments (3000) Sales of Plant & Equipment Common Stock Shares Outstanding (000) Price Per Share Earnings Per Share Max Stock (000) Is Stock (5000) Max Shock (5000) Retire Stock (5000) Dividend w Share Current Debt Interest Rate Due This Year Borrow (5000) Cash Positions December 31, 2023 O December 31, 2024 $ 100 $1.51) $400 $ 0 $ 100 $ 0 $ 0.00 11.9% $7,076 SO Long Term Debt Retire Long Term Debt ($000) O Issue Long Term Debt (5000) $ 0 Long Term Interest Rate 13.394 Maximum Issue This Year $4,401 MR Lag (days) 30 A/P Lag (days) 30 Outstanding Bonds Series Number Face Amount Current Yield 2023 Close 12.052024 $ 1,733 12.1% $ 98.85 13.052026 $ 2,600 13.1% $99.30 10.052031 $2,000 11.9% $ 84.33 10.652032 $ 6,018 12.3% $ 86.30 13.152033 $5,351 13.295 $98.93 $0 37,651) Process Management Initiatives Projected Impact Budget (5000) $ Total Current Expenditures (5000) $0 0 0 $ Worst Case Best Case o $ 0.0% 0 $ 0 CP Systems Vendo Quality Initiative Training Channel Support Systems Concurrent Engineering UNEP Green Program Benchmarkno Quality Function Deployment fort CCE/6 Sigma Training GENTOEM Samatytives Reduction in Cost of Goods For the Year Just Ended Andrews Projected Outive Impact Material Cost Reduction Labor Cost Rection Reduction RSD de Time Reduction in Admin Costs Dersand increase 0.0 0.0% 0.04 0.04 S 0 0.0 0 $ 0 Admin Cost Reductions For the Year Just Ended RAD Cycle Time Reductions For the Year Just Ended Demand Increase For the Year Just Ended A taldwin Chester Che 0 Chester DU 0 09 Admin Cost Recon Roche Tech Demand Malate 


Step by Step Solution
There are 3 Steps involved in it
Step: 1

Get Instant Access to Expert-Tailored Solutions
See step-by-step solutions with expert insights and AI powered tools for academic success
Step: 2

Step: 3

Ace Your Homework with AI
Get the answers you need in no time with our AI-driven, step-by-step assistance
Get Started


