

Answered step by step
Verified Expert Solution
Question
1 Approved Answer
What do you need? Please Disregard, it's been resubmitted. Given Data Shares Outstanding (Procter & Gamble) Shares Outstanding (Johnson & Johnson) Income Statements Total Revenue
What do you need?
Please Disregard, it's been resubmitted.
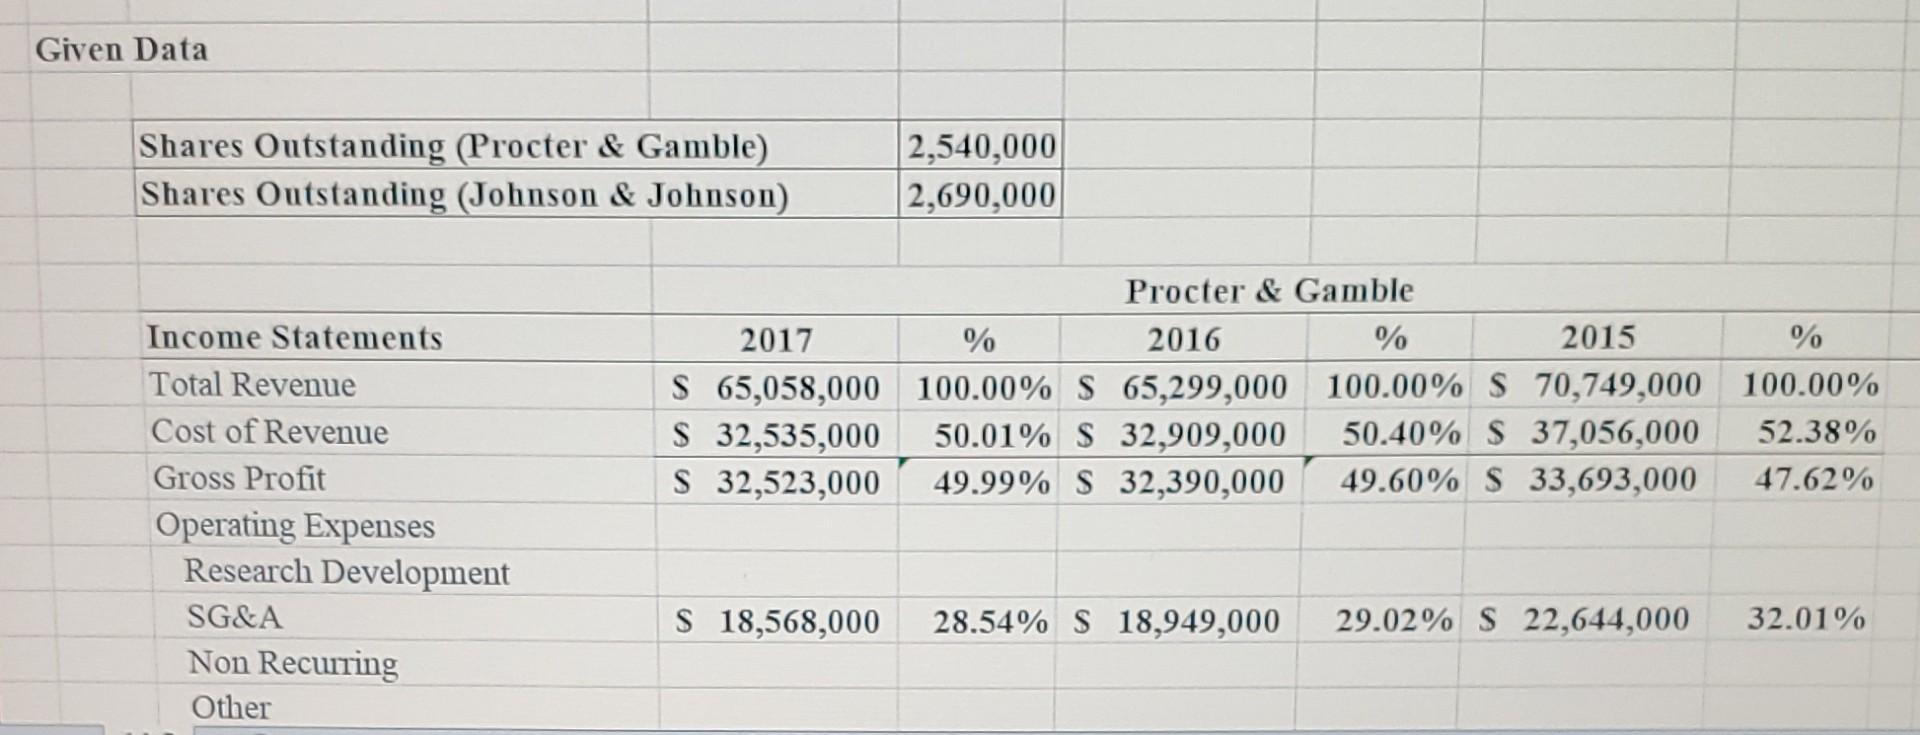
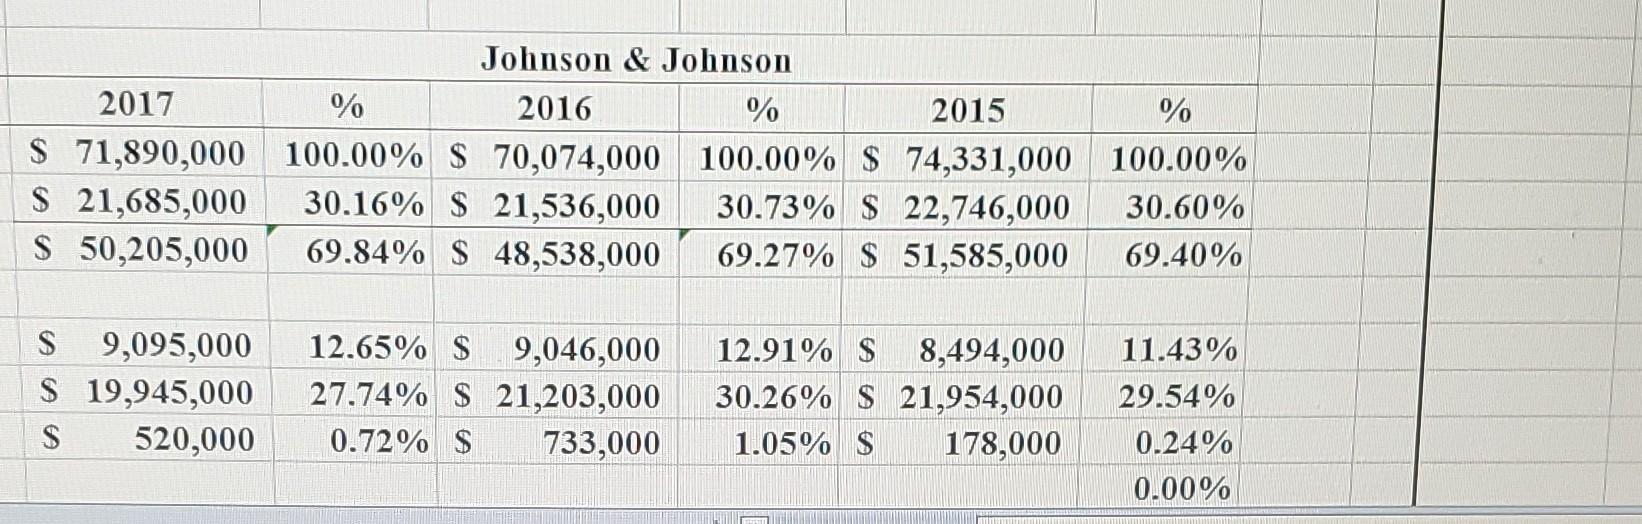
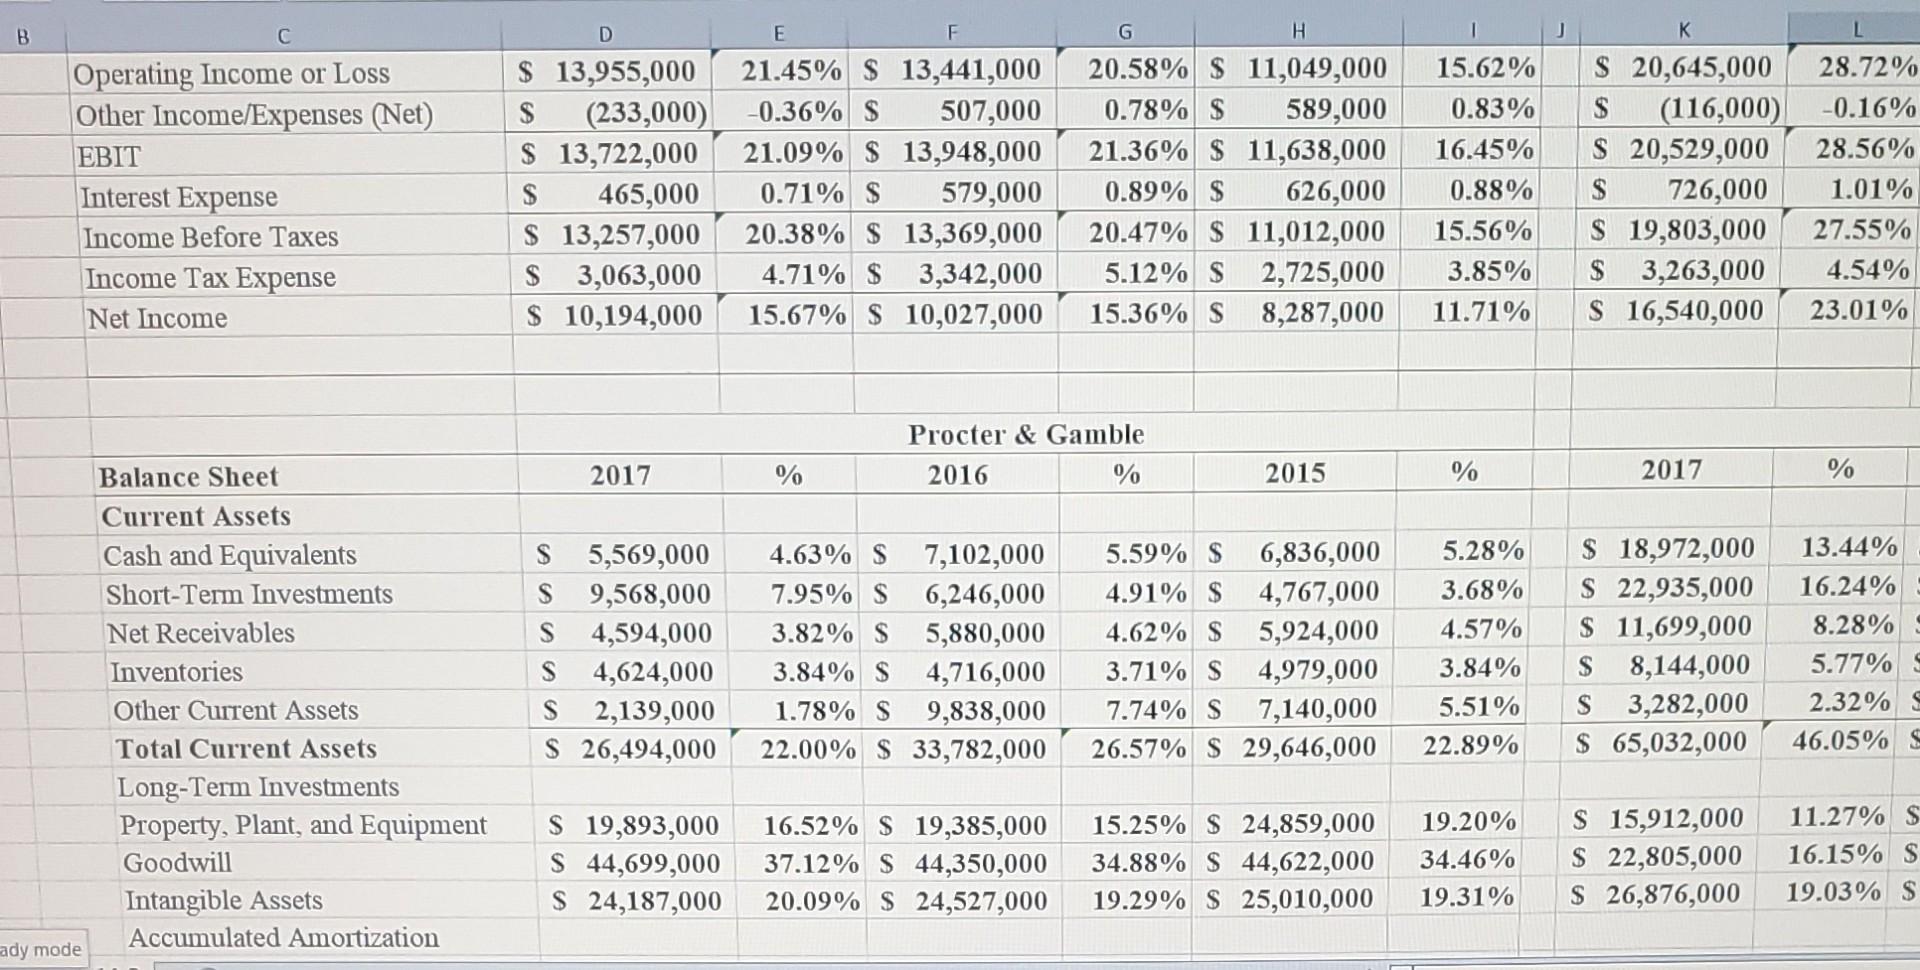
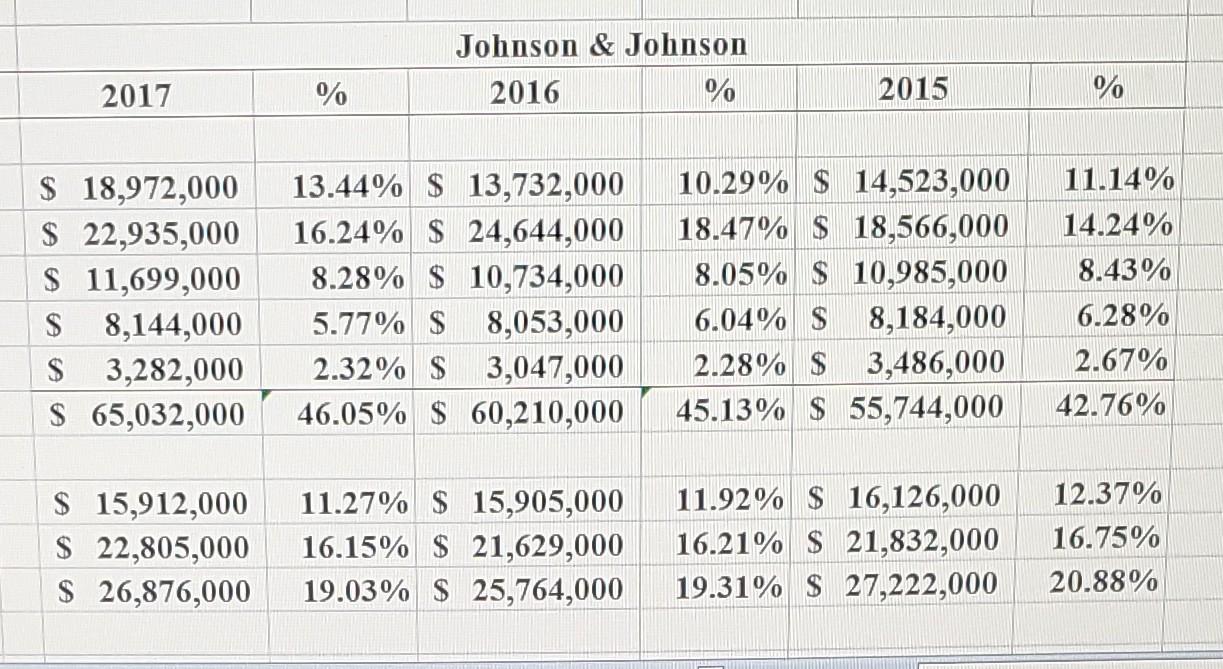
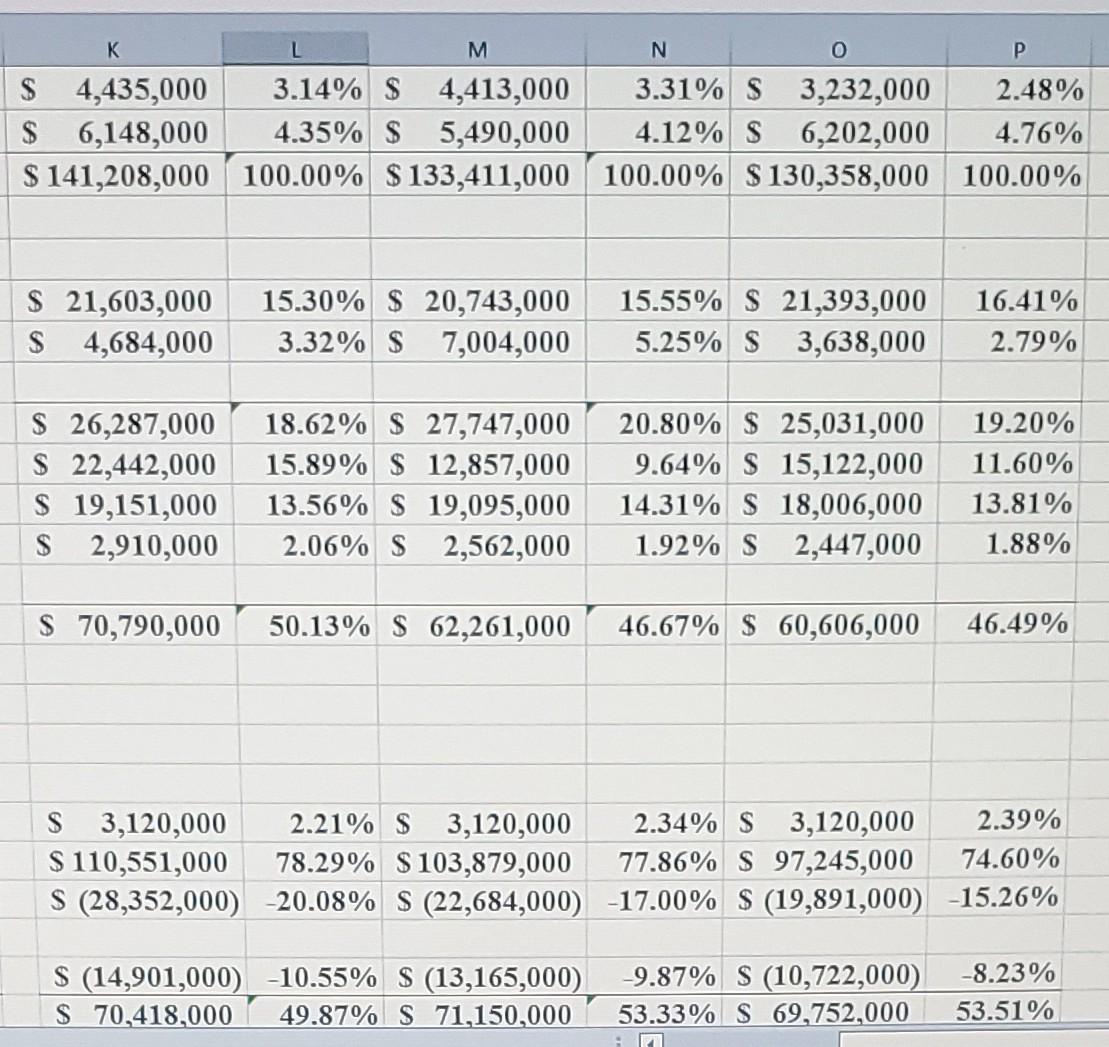
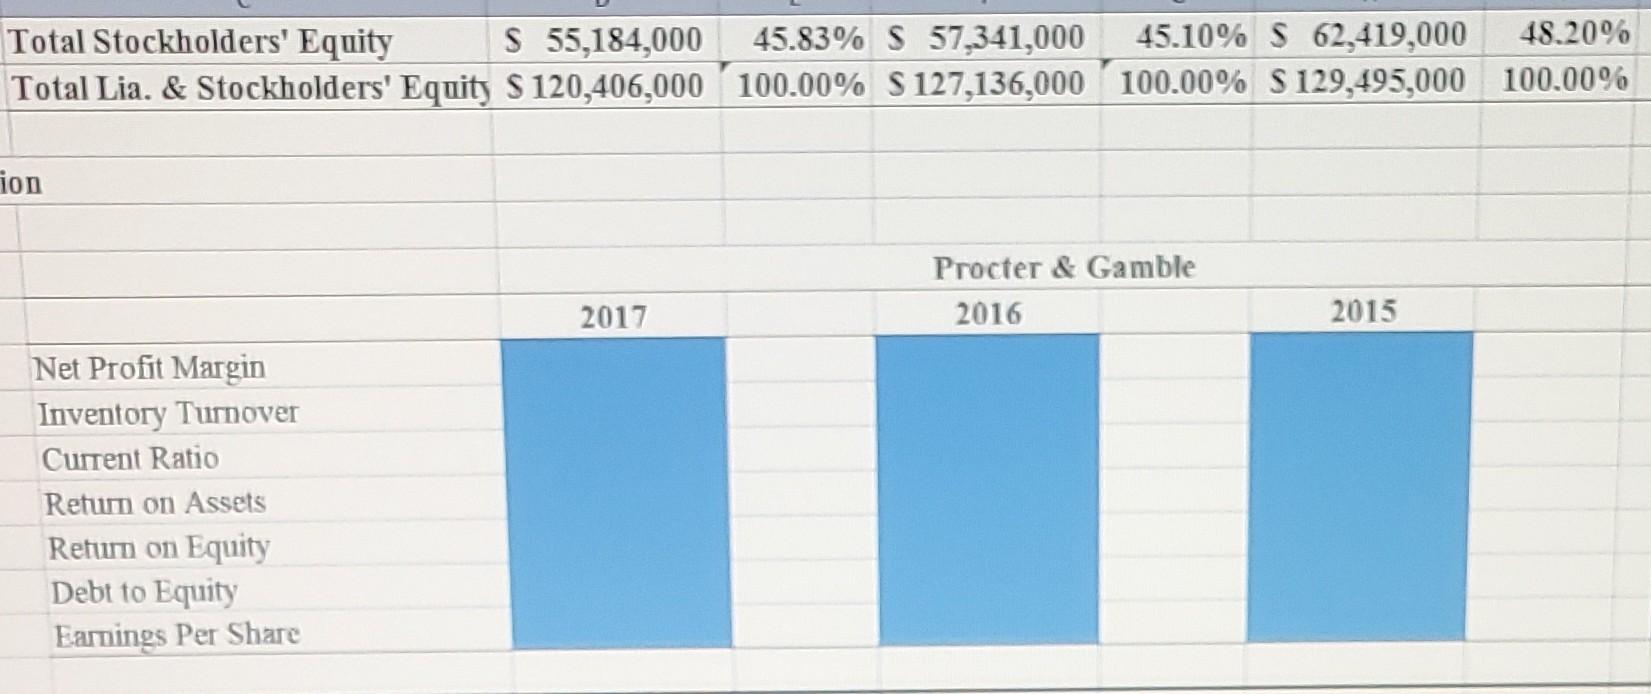
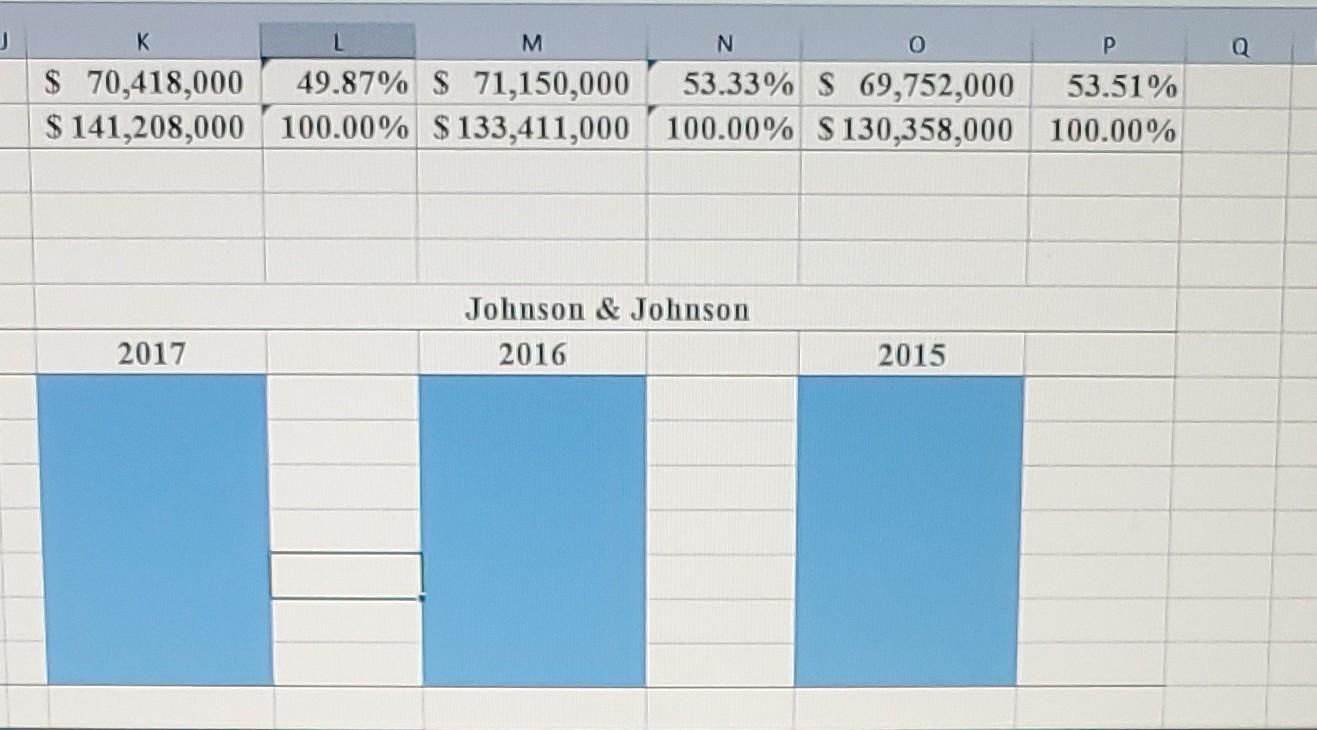
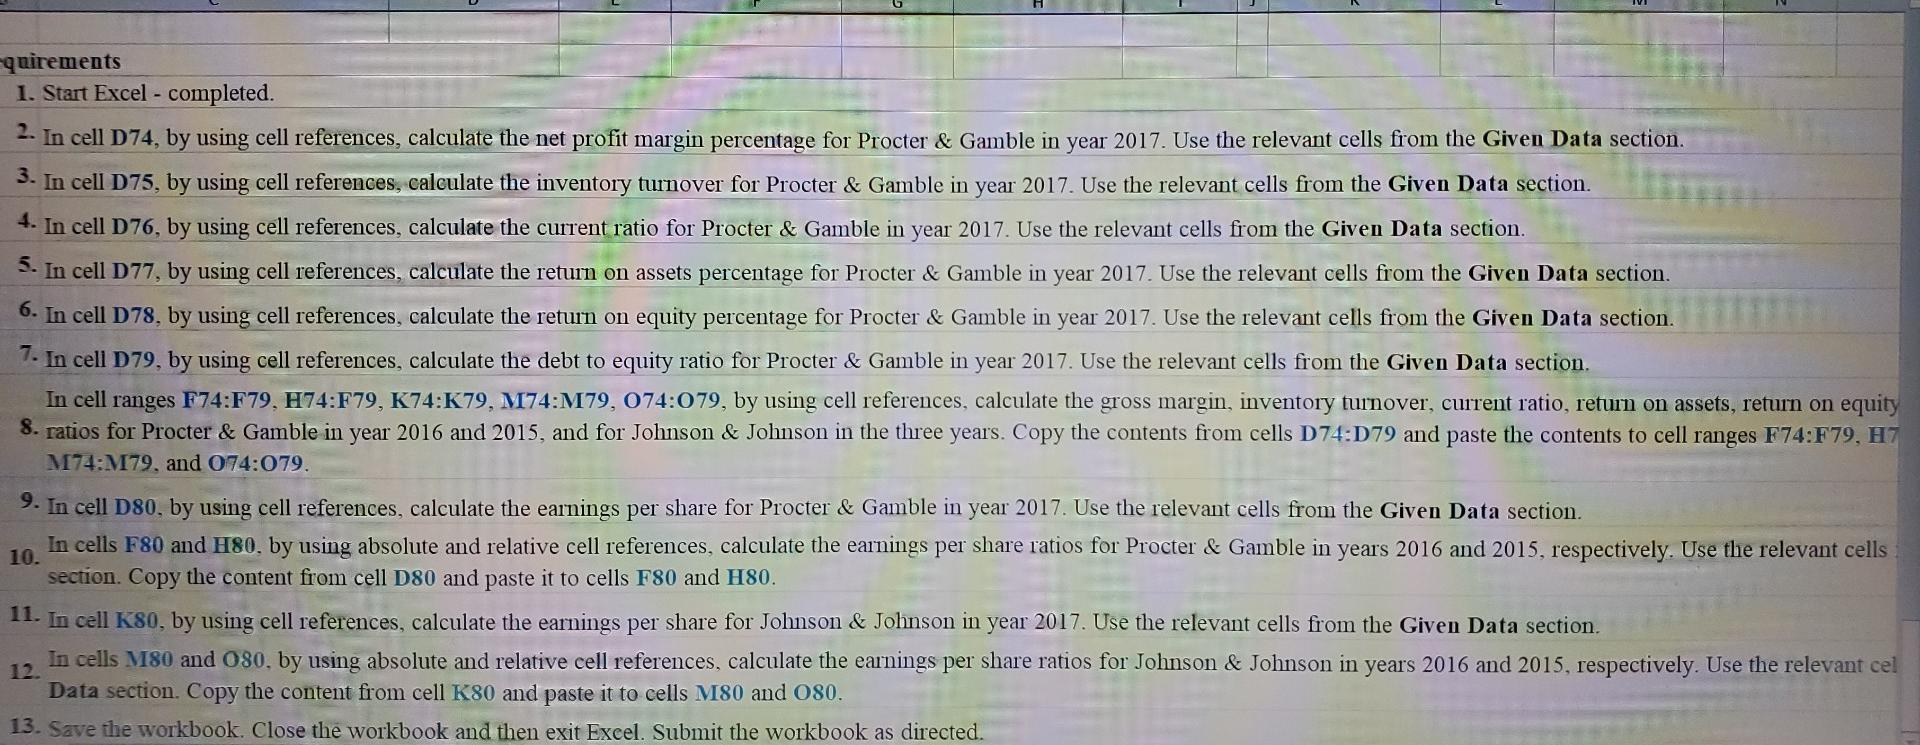
Given Data Shares Outstanding (Procter & Gamble) Shares Outstanding (Johnson & Johnson) Income Statements Total Revenue Cost of Revenue Gross Profit Operating Expenses Research Development SG&A Non Recurring Other 2,540,000 2,690,000 Procter & Gamble 2017 % 2016 % 2015 S 65,058,000 100.00% S 65,299,000 100.00% $ 70,749,000 S 32,535,000 S 32,523,000 50.01% S 32,909,000 49.99% S 32,390,000 50.40% $ 37,056,000 49.60% $ 33,693,000 S 18,568,000 28.54% S 18,949,000 29.02% S 22,644,000 % 100.00% 52.38% 47.62% 32.01% 2017 S 71,890,000 $ 21,685,000 $ 50,205,000 S 9,095,000 $ 19,945,000 S Johnson & Johnson 2016 % 2015 $ 70,074,000 100.00% $74,331,000 30.73% $ 22,746,000 69.27% $ 51,585,000 % 100.00% 30.16% $ 21,536,000 69.84% $ 48,538,000 12.65% S 9,046,000 27.74% $ 21,203,000 520,000 0.72% S 733,000 12.91% S 8,494,000 30.26% $ 21,954,000 1.05% S 178,000 % 100.00% 30.60% 69.40% 11.43% 29.54% 0.24% 0.00% B C Operating Income or Loss Other Income/Expenses (Net) EBIT Interest Expense Income Before Taxes Income Tax Expense Net Income ady mode Balance Sheet Current Assets Cash and Equivalents Short-Term Investments Net Receivables Inventories Other Current Assets Total Current Assets Long-Term Investments Property, Plant, and Equipment Goodwill Intangible Assets Accumulated Amortization D E F $ 13,955,000 21.45% $ 13,441,000 S (233,000) -0.36% S 507,000 $ 13,722,000 $ 465,000 $ 13,257,000 21.09% $ 13,948,000 0.71% S 579,000 20.38% 13,369,000 4.71% $ 3,342,000 $ 3,063,000 $ 10,194,000 15.67% $ 10,027,000 S 2017 5,569,000 9,568,000 4,594,000 S 4,624,000 2,139,000 S S 26,494,000 S S $ 19,893,000 S 44,699,000 $ 24,187,000 % G H 20.58% $ 11,049,000 0.78% S 589,000 21.36% $ 11,638,000 0.89% $ 626,000 20.47% $ 11,012,000 5.12% S 15.36% S 2,725,000 8,287,000 Procter & Gamble 2016 % 16.52% $ 19,385,000 37.12% S 44,350,000 20.09% S 24,527,000 2015 4.63% S 7.95% S 6,246,000 3.82% S 5,880,000 7,102,000 5.59% S 6,836,000 4.91% S 4,767,000 4.62% S 5,924,000 3.71% S 4,979,000 7.74% S 7,140,000 26.57% $ 29,646,000 3.84% S 4,716,000 1.78% S 9,838,000 22.00% $ 33,782,000 15.25% $ 24,859,000 34.88% S 44,622,000 19.29% $ 25,010,000 15.62% 0.83% 16.45% 0.88% 15.56% 3.85% 11.71% % 5.28% 3.68% 4.57% 3.84% 5.51% 22.89% 19.20% 34.46% 19.31% J K 28.72% $ 20,645,000 S (116,000) -0.16% 28.56% $ 20,529,000 $ 726,000 1.01% $ 19,803,000 27.55% 4.54% 23.01% $ 3,263,000 $ 16,540,000 2017 $ 18,972,000 $ 22,935,000 $ 11,699,000 S 8,144,000 S 3,282,000 $ 65,032,000 $ 15,912,000 $ 22,805,000 $ 26,876,000 % 13.44% 16.24% 8.28% 5.77% 2.32% 46.05% S 11.27% S 16.15% S 19.03% S 2017 $ 18,972,000 $ 22,935,000 $ 11,699,000 $ 8,144,000 $ 3,282,000 $ 65,032,000 % Johnson & Johnson 2016 % 13.44% $ 13,732,000 16.24% $ 24,644,000 8.28% $10,734,000 5.77% S 8,053,000 2.32% S 3,047,000 46.05% $ 60,210,000 $ 15,912,000 $ 22,805,000 11.27% $ 15,905,000 16.15% $ 21,629,000 $ 26,876,000 19.03% $ 25,764,000 2015 10.29% $ 14,523,000 18.47% $ 18,566,000 8.05% $ 10,985,000 6.04% S 8,184,000 2.28% S 3,486,000 45.13% $ 55,744,000 11.92% $ 16,126,000 16.21% $ 21,832,000 19.31% $ 27,222,000 % 11.14% 14.24% 8.43% 6.28% 2.67% 42.76% 12.37% 16.75% 20.88% K S 4,435,000 $ 6,148,000 $ 141,208,000 100.00% $133,411,000 M 3.14% S 4,413,000 4.35% S 5,490,000 $ 21,603,000 15.30% $ 20,743,000 S 4,684,000 3.32% S 7,004,000 $ 26,287,000 S 22,442,000 $ 19,151,000 S 2,910,000 $ 70,790,000 18.62% S 27,747,000 15.89% $ 12,857,000 13.56% $ 19,095,000 2.06% S 2,562,000 50.13% $ 62,261,000 N 0 P 2.48% 3.31% S 3,232,000 4.12% S 6,202,000 4.76% 100.00% $ 130,358,000 100.00% S (14,901,000) -10.55% S (13,165,000) S 70,418,000 49.87% S 71,150,000 15.55% $ 21,393,000 5.25% S 3,638,000 16.41% 2.79% 19.20% 20.80% $25,031,000 9.64% S 15,122,000 11.60% 14.31% $ 18,006,000 13.81% 1.92% S 2,447,000 1.88% 46.67% $ 60,606,000 46.49% 2.39% S 3,120,000 $ 110,551,000 S (28,352,000) -20.08% S (22,684,000) -17.00% S (19,891,000) -15.26% 2.21% S 3,120,000 78.29% $103,879,000 2.34% S 3,120,000 77.86% S 97,245,000 74.60% -9.87% S (10,722,000) 53.33% S 69,752,000 : 7 -8.23% 53.51% Total Stockholders' Equity Total Lia. & Stockholders' Equity ion Net Profit Margin Inventory Turnover Current Ratio Return on Assets Return on Equity Debt to Equity Earnings Per Share S 55,184,000 45.83% S 57,341,000 45.10% S 62,419,000 48.20% $ 120,406,000 100.00% S127,136,000 100.00% S129,495,000 100.00% 2017 Procter & Gamble 2016 2015 J K M $ 70,418,000 49.87% $ 71,150,000 $ 141,208,000 100.00% $133,411,000 100.00% 2017 N 0 53.33% $ 69,752,000 $ 130,358,000 Johnson & Johnson 2016 2015 P 53.51% 100.00% Q quirements 1. Start Excel - completed. 2. In cell D74, by using cell references, calculate the net profit margin percentage for Procter & Gamble in year 2017. Use the relevant cells from the Given Data section. 3. In cell D75, by using cell references, calculate the inventory turnover for Procter & Gamble in year 2017. Use the relevant cells from the Given Data section. 4. In cell D76, by using cell references, calculate the current ratio for Procter & Gamble in year 2017. Use the relevant cells from the Given Data section. 5. In cell D77, by using cell references, calculate the return on assets percentage for Procter & Gamble in year 2017. Use the relevant cells from the Given Data section. 6. In cell D78, by using cell references, calculate the return on equity percentage for Procter & Gamble in year 2017. Use the relevant cells from the Given Data section. 7. In cell D79, by using cell references, calculate the debt to equity ratio for Procter & Gamble in year 2017. Use the relevant cells from the Given Data section. In cell ranges F74:F79, H74:F79, K74:K79, M74:M79, 074:079, by using cell references, calculate the gross margin, inventory turnover, current ratio, return on assets, return on equity 8. ratios for Procter & Gamble in year 2016 and 2015, and for Johnson & Johnson in the three years. Copy the contents from cells D74:D79 and paste the contents to cell ranges F74:F79, H7 M74:M79, and 074:079. 9. In cell D80, by using cell references, calculate the earnings per share for Procter & Gamble in year 2017. Use the relevant cells from the Given Data section. 10. In cells F80 and H80, by using absolute and relative cell references, calculate the earnings per share ratios for Procter & Gamble in years 2016 and 2015, respectively. Use the relevant cells section. Copy the content from cell D80 and paste it to cells F80 and H80. 11. In cell K80, by using cell references, calculate the earnings per share for Johnson & Johnson in year 2017. Use the relevant cells from the Given Data section. 12. In cells M80 and 080, by using absolute and relative cell references, calculate the earnings per share ratios for Johnson & Johnson in years 2016 and 2015, respectively. Use the relevant cel Data section. Copy the content from cell K80 and paste it to cells M80 and 080. 13. Save the workbook. Close the workbook and then exit Excel. Submit the workbook as directedStep by Step Solution
There are 3 Steps involved in it
Step: 1

Get Instant Access to Expert-Tailored Solutions
See step-by-step solutions with expert insights and AI powered tools for academic success
Step: 2

Step: 3
Ace Your Homework with AI
Get the answers you need in no time with our AI-driven, step-by-step assistance
Get Started
Financial Accounting An Integrated Approach
Authors: Michael Gibbins
6th Edition
0176407251, 978-0176407254