

Question
What does the AS-AD analysis look like for the U.S. in the period before the COVID shock hit? That is, where is Point A on
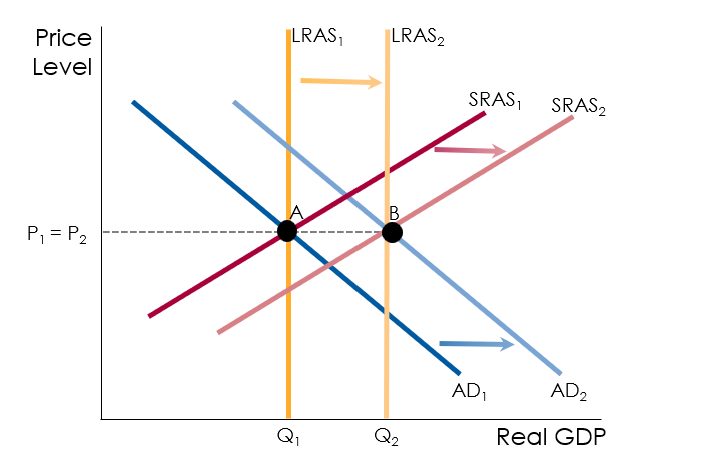
What does the AS-AD analysis look like for the U.S. in the period before the COVID shock hit? That is, where is Point A on the AS-AD graph?Be sure fully explain why you have modelled Point A (time 0) as you have. Your explanation should address the unemployment, output, and inflation/deflation dynamics at the time as well as considering the components of aggregate demand.
Step by Step Solution
There are 3 Steps involved in it
Step: 1

Get Instant Access to Expert-Tailored Solutions
See step-by-step solutions with expert insights and AI powered tools for academic success
Step: 2

Step: 3
Ace Your Homework with AI
Get the answers you need in no time with our AI-driven, step-by-step assistance
Get Started
Using R For Econometrics
Authors: Florian Heiss
1st Edition
1523285133, 9781523285136