Answered step by step
Verified Expert Solution
Question
1 Approved Answer
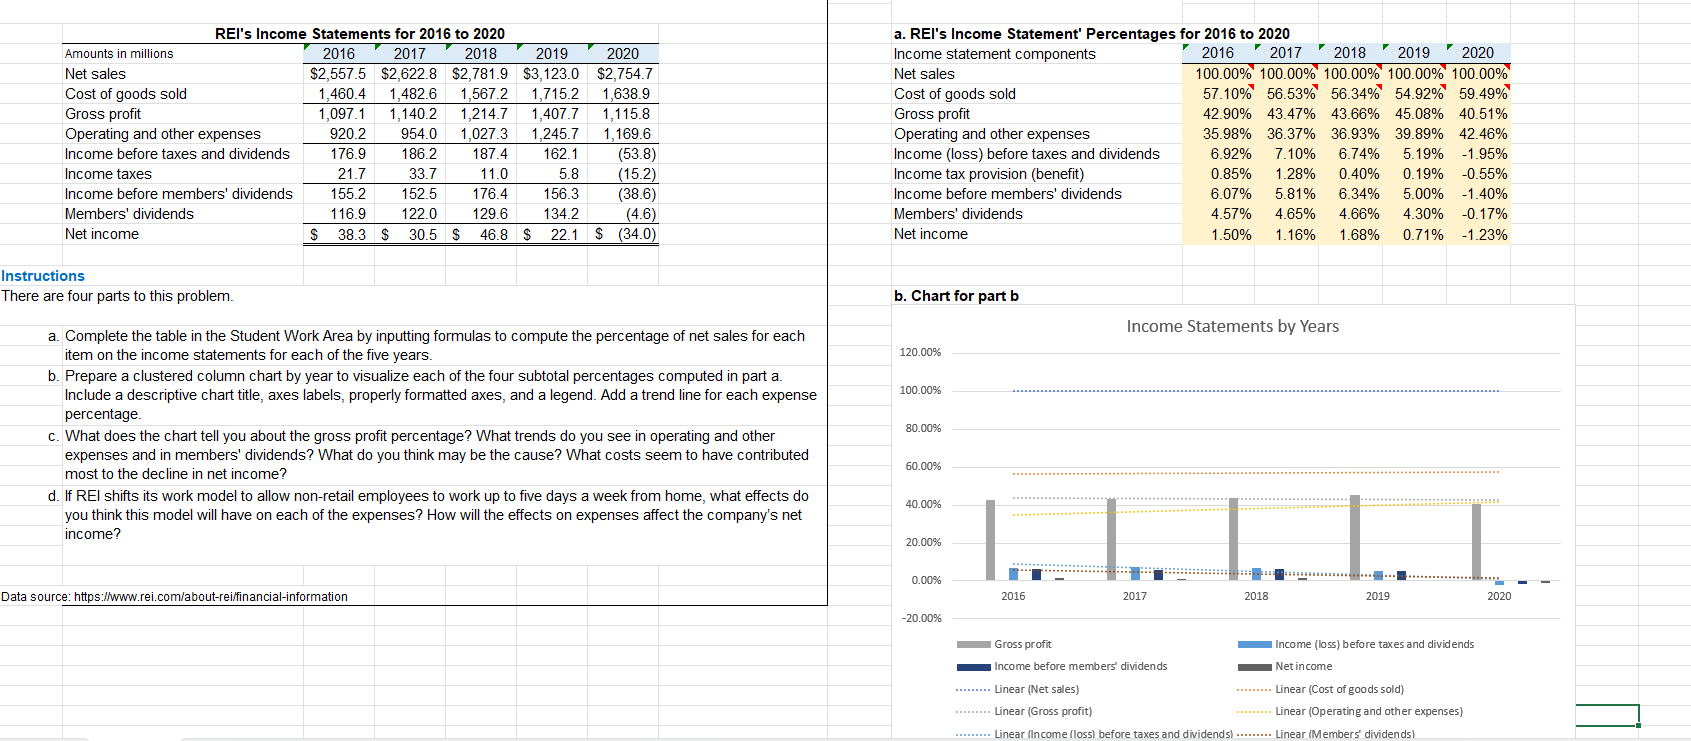
What does the chart tell you about the gross profit percentage? What trends do you see in operating and other expenses and in members' dividends?
- What does the chart tell you about the gross profit percentage? What trends do you see in operating and other expenses and in members' dividends? What do you think may be the cause? What costs seem to have contributed most to the decline in net income?
- If REI shifts its work model to allow non-retail employees to work up to five days a week from home, what effects do you think this model will have on each of the expenses? How will the effects on expenses affect the companys net income?
 a. Complete the table in the Student Work Area by inputting formulas to compute the percentage of net sales for each item on the income statements for each of the five years. b. Prepare a clustered column chart by year to visualize each of the four subtotal percentages computed in part a. Include a descriptive chart title, axes labels, properly formatted axes, and a legend. Add a trend line for each expense percentage. c. What does the chart tell you about the gross profit percentage? What trends do you see in operating and other expenses and in members' dividends? What do you think may be the cause? What costs seem to have contributed most to the decline in net income? d. If REl shifts its work model to allow non-retail employees to work up to five days a week from home, what effects do you think this model will have on each of the expenses? How will the effects on expenses affect the company's net income
 Step by Step Solution
There are 3 Steps involved in it
Step: 1

Get Instant Access to Expert-Tailored Solutions
See step-by-step solutions with expert insights and AI powered tools for academic success
Step: 2

Step: 3

Ace Your Homework with AI
Get the answers you need in no time with our AI-driven, step-by-step assistance
Get Started


