Answered step by step
Verified Expert Solution
Link Copied!

Question

1 Approved Answer

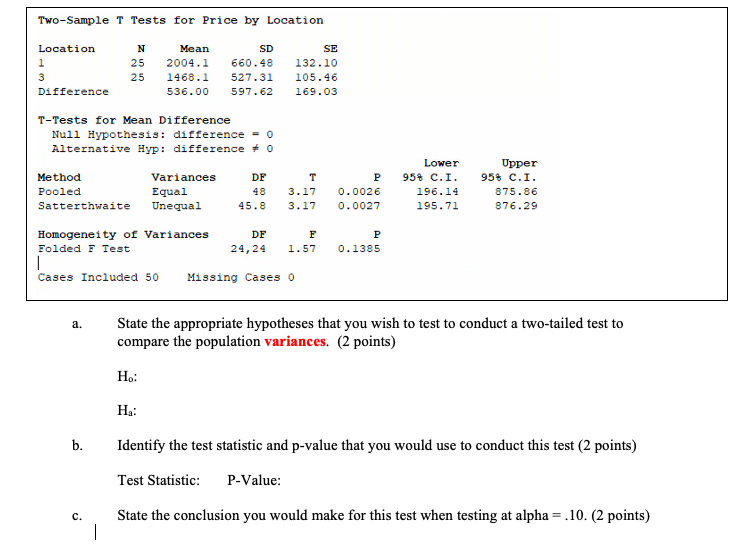
what even is statistics please help Two-Sample T Tests for Price by Location Location N Mean SD SE 25 2004.1 660. 48 132. 10 25

what even is statistics please help

image text in transcribed
Two-Sample T Tests for Price by Location Location N Mean SD SE 25 2004.1 660. 48 132. 10 25 1468. 1 527.31 105 . 46 Difference 536.00 597 . 62 169.03 T-Tests for Mean Difference Null Hypothesis: difference = 0 Alternative Hyp: difference # 0 Lower Upper Method Variances DF T P 95% C.I. 95% C.I. Pooled Equal 48 3.17 0. 0026 196. 14 875.86 Satterthwaite Unequal 45.8 3.17 0. 0027 195.71 876.29 Homogeneity of Variances DF F P Folded F Test 24, 24 1. 57 0. 1385 Cases Included 50 Missing Cases 0 a. State the appropriate hypotheses that you wish to test to conduct a two-tailed test to compare the population variances. (2 points) Ho: Ha: b. Identify the test statistic and p-value that you would use to conduct this test (2 points) Test Statistic: P-Value: C. State the conclusion you would make for this test when testing at alpha = .10. (2 points)

Step by Step Solution

There are 3 Steps involved in it

Step: 1

blur-text-image

Get Instant Access to Expert-Tailored Solutions

See step-by-step solutions with expert insights and AI powered tools for academic success

Step: 2

blur-text-image

Step: 3

blur-text-image

Ace Your Homework with AI

Get the answers you need in no time with our AI-driven, step-by-step assistance

Get Started

Recommended Textbook for

Square Summable Power Series

Authors: Louis De Branges, James Rovnyak

1st Edition

0486801365, 9780486801360

More Books

Students also viewed these Mathematics questions

Question

Complexity of linear search is O ( n ) . Your answer: True False

Answered: 1 week ago