WHAT FINAL EXCEL SHOULD LOOK LIKE:
EXCEL GIVEN:
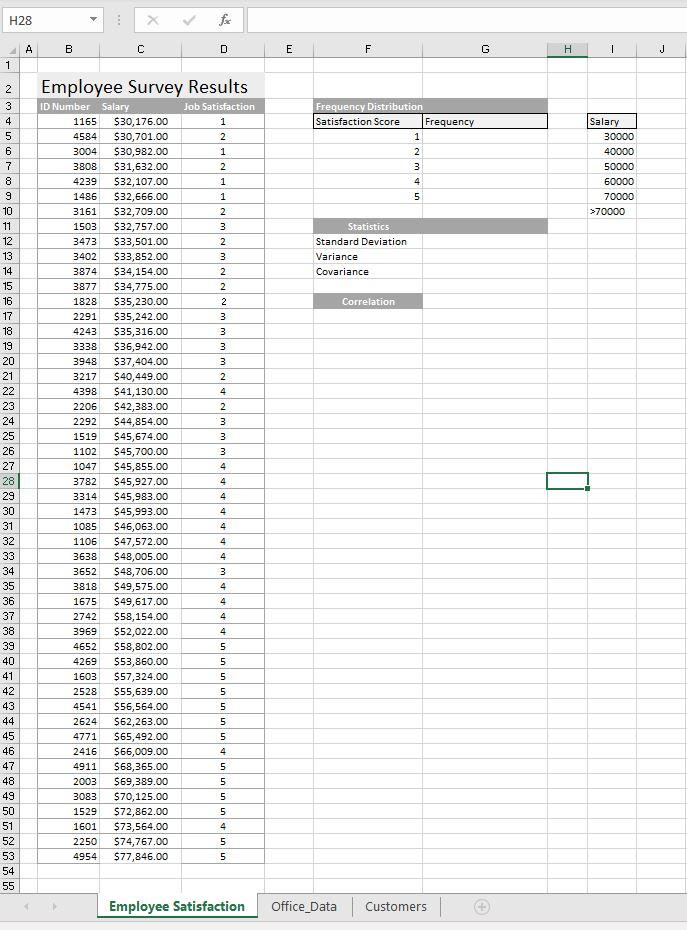
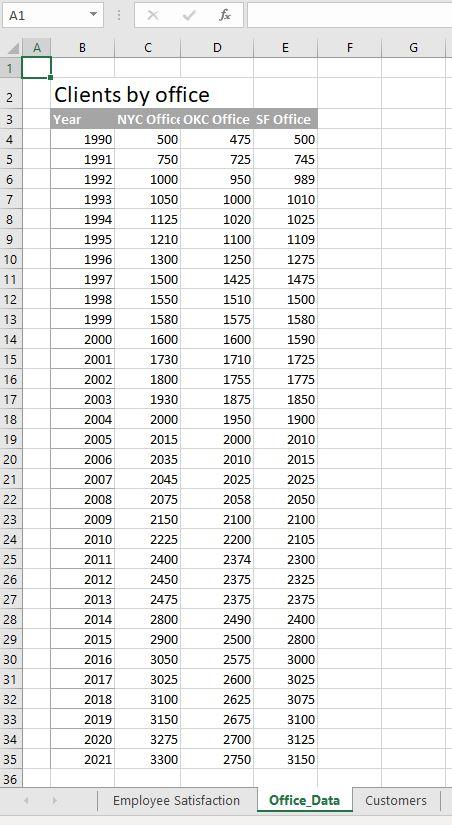
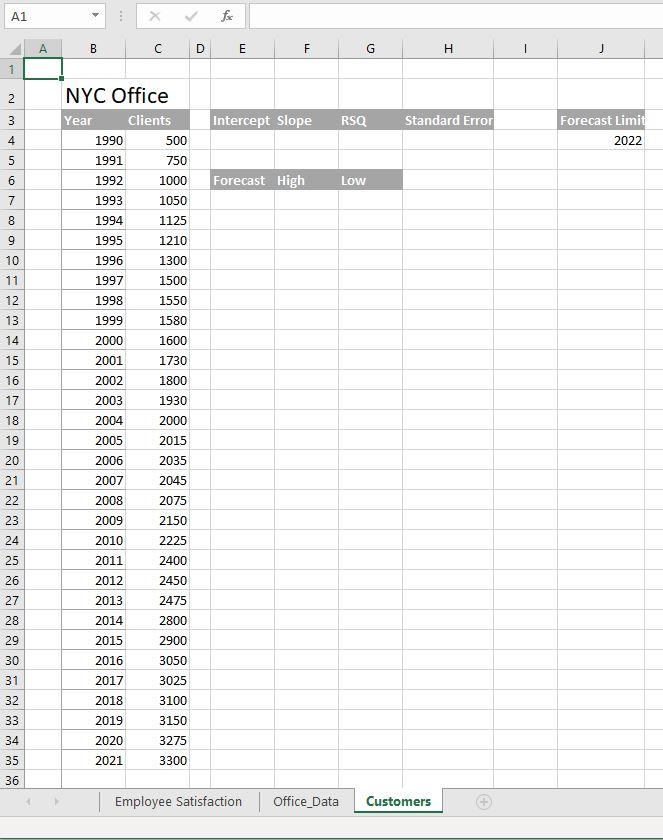
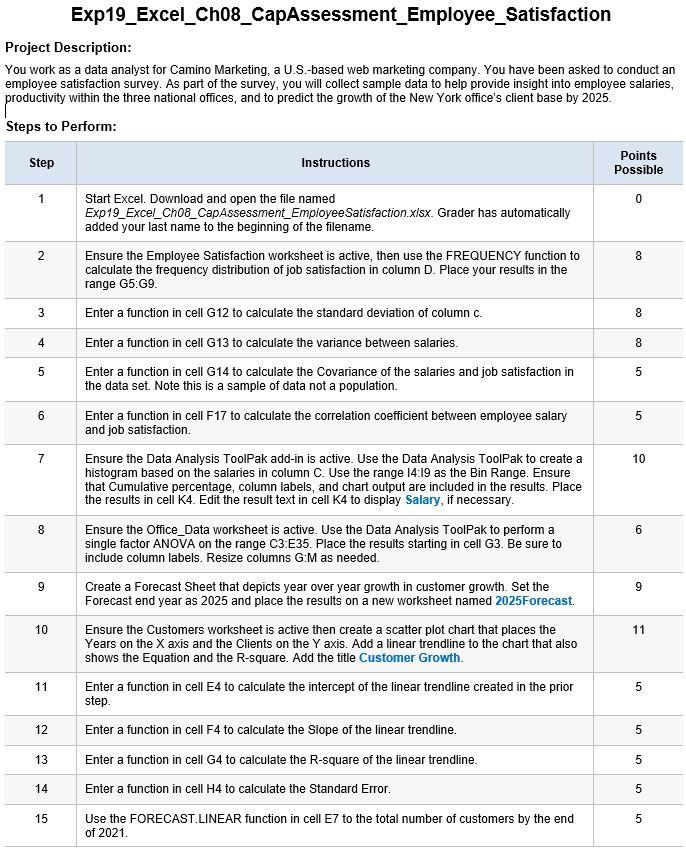
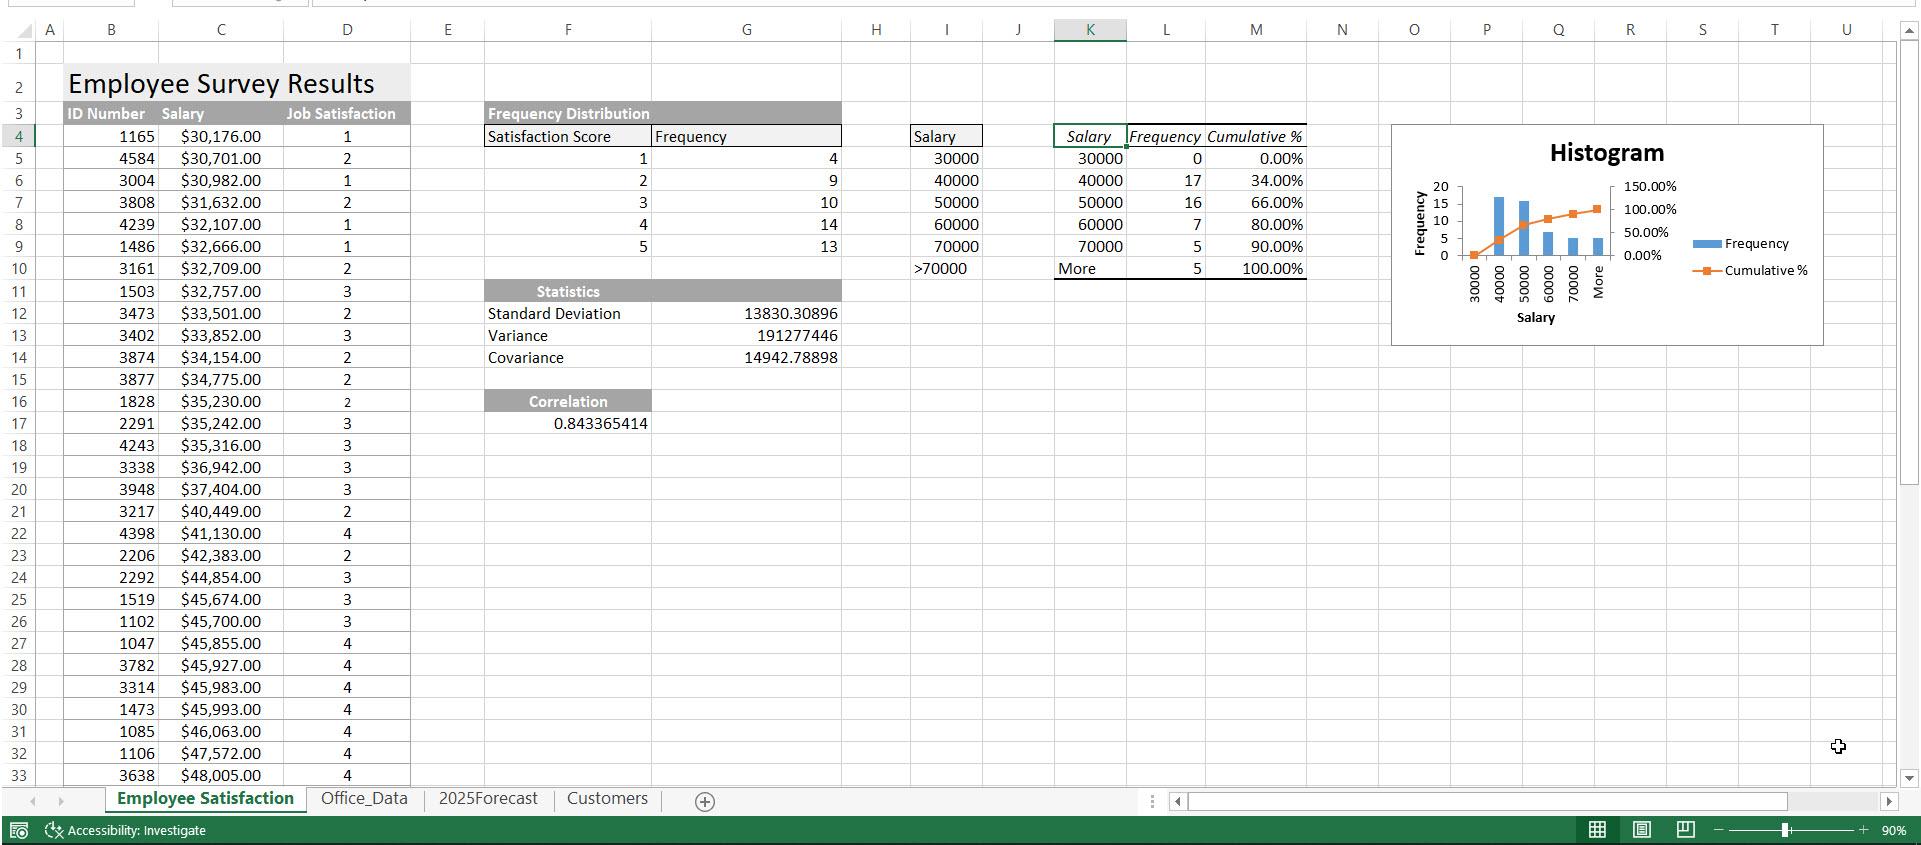
Exp19_Excel_Ch08_CapAssessment_Employee_Satisfaction Project Description: You work as a data analyst for Camino Marketing, a U.S.-based web marketing company. You have been asked to conduct an employee satisfaction survey. As part of the survey, you will collect sample data to help provide insight into employee salaries, productivity within the three national offices, and to predict the growth of the New York office's client base by 2025. Steps to Perform: Step Instructions Points Possible 1 0 2 8 8 8 4 4 5 5 6 5 7 10 Start Excel. Download and open the file named Exp19_Excel_Cho8_CapAssessment_Employee Satisfaction.xlsx. Grader has automatically added your last name to the beginning of the filename. Ensure the Employee Satisfaction worksheet is active, then use the FREQUENCY function to calculate the frequency distribution of job satisfaction in column D. Place your results in the range G5:49. Enter a function in cell G12 to calculate the standard deviation of column c. Enter a function in cell G13 to calculate the variance between salaries. Enter a function in cell G14 to calculate the Covariance of the salaries and job satisfaction in the data set. Note this is a sample of data not a population. Enter a function in cell F17 to calculate the correlation coefficient between employee salary and job satisfaction Ensure the Data Analysis ToolPak add-in is active. Use the Data Analysis ToolPak to create a histogram based on the salaries in column C. Use the range 14:19 as the Bin Range. Ensure that Cumulative percentage, column labels, and chart output are included in the results. Place the results in cell K4. Edit the result text in cell K4 to display Salary, if necessary. Ensure the Office_Data worksheet is active. Use the Data Analysis ToolPak to perform a single factor ANOVA on the range C3.E35. Place the results starting in cell G3. Be sure to include column labels. Resize columns G:M as needed. Create a Forecast Sheet that depicts year over year growth in customer growth. Set the Forecast end year as 2025 and place the results on a new worksheet named 2025Forecast. Ensure the Customers worksheet is active then create a scatter plot chart that places the Years on the X axis and the Clients on the Y axis. Add a linear trendline to the chart that also shows the Equation and the R-square. Add the title Customer Growth. Enter a function in cell E4 to calculate the intercept of the linear trendline created in the prior step. Enter a function in cell F4 to calculate the Slope of the linear trendline. Enter a function in cell G4 to calculate the R-square of the linear trendline. Enter a function in cell H4 to calculate the Standard Error. Use the FORECAST.LINEAR function in cell E7 to the total number of customers by the end of 2021 8 6 9 9 10 11 11 LO 12 5 13 5 14 5 15 5 16 LO Complete your analysis by added formulas in the range F7:67 to calculate the high and low thresholds of the forecast Save and close Exp19_Exce_Chos_CapAssessment_Employee Satisfaction.xlsx. Exit Excel. Submit the file as directed. 17 0 Total Points 100 A B C D E F G H 1 J K L M N o P Q R S T U 1 Employee Survey Results Frequency Distribution Satisfaction Score Frequency 1 4 Histogram 2 9 150.00% 3 Salary 30000 40000 50000 60000 70000 >70000 10 14 13 Salary_lFrequency Cumulative % 30000 0 0.00% 40000 17 34.00% 50000 16 66.00% 60000 7 80.00% 70000 5 90.00% More 5 100.00% 4 5 100.00% 50.00% 0.00% Frequency -Cumulative % 30000 More Salary Statistics Standard Deviation Variance Covariance 13830.30896 191277446 14942.78898 Correlation 0.843365414 2 3 ID Number Salary Job Satisfaction 4 1165 $30,176.00 1 5 4584 $30,701.00 2 6 3004 $30,982.00 1 7 3808 $31,632.00 2 8 4239 $32,107.00 1 9 1486 $32,666.00 1 10 3161 $32,709.00 2 11 1503 $32,757.00 3 12 3473 $33,501.00 2 13 3402 $33,852.00 3 14 3874 $34,154.00 2 15 3877 $34,775.00 2 16 1828 $35,230.00 2 17 2291 $35,242.00 3 18 4243 $35,316.00 3 19 3338 $36,942.00 3 20 3948 $37,404.00 3 21 3217 $40,449.00 2 22 4398 $41,130.00 4 23 2206 $42,383.00 2 24 2292 $44,854.00 3 25 1519 $45,674.00 3 26 1102 $45,700.00 3 27 1047 $45,855.00 4 28 3782 $45,927.00 4 29 3314 $45,983.00 4 30 1473 $45,993.00 4 31 1085 $46,063.00 4 32 1106 $ 47,572.00 4 33 3638 $48,005.00 4 Employee Satisfaction Office_Data ED Accessibility: Investigate 2025Forecast Customers + . B + 90% H28 A B C E F G H J 1 Employee Survey Results Job Satisfaction 1 2 1 2 Frequency Distribution Satisfaction Score Frequency 1 2 3 Salary 30000 40000 50000 60000 70000 >70000 4 5 1 1 2 3 2 3 2 2 2 Statistics Standard Deviation Variance Covariance Correlation 3 3 3 3 2 4 2 3 3 3 4 2 3 4 5 6 7 8 9 10 11 12 13 14 15 16 17 18 19 20 21 22 23 24 25 26 27 28 29 30 31 32 33 34 35 36 37 38 39 40 41 42 43 44 45 46 47 48 49 50 51 52 53 54 55 ID Number Salary 1165 $30,176.00 4584 $30,701.00 3004 $30,982.00 3808 $31,632.00 4239 $32, 107.00 1486 $32,666.00 3161 $32,709.00 1503 $32,757.00 3473 $33,501.00 3402 $33,852.00 3874 $34,154.00 3877 $34,775.00 1828 $35,230.00 2291 $35,242.00 4243 $35,316.00 3338 $36,942.00 3948 $37,404.00 3217 $40,449.00 4398 $41,130.00 2206 $42,383.00 2292 $44,854.00 1519 $45,674.00 1102 $45,700.00 1047 $45,855.00 3782 $45,927.00 3314 $45,983.00 1473 $45,993.00 1085 $46,063.00 1106 $ 47,572.00 3638 $ 48,005.00 3652 $48,706.00 3818 $49,575.00 1675 $49,617.00 2742 $58,154.00 3969 $52,022.00 4652 $58,802.00 4269 $53,860.00 1603 $57,324.00 2528 $55,639.00 4541 $56,564.00 2624 $62,263.00 4771 $65,492.00 2416 $66,009.00 4911 $68,365.00 2003 $69,389.00 3083 $70,125.00 1529 $72,862.00 1601 $73,564.00 2250 $74,767.00 4954 $77,846.00 4 4 4 4 4 4 3 4 4 4 4 5 5 5 5 5 5 5 4 5 5 4 Employee Satisfaction Office_Data Customers A1 X fi F G 3 00 AA B C D E 1 2 Clients by office 3 Year NYC Office OKC Office SF Office 4 1990 500 475 500 5 1991 750 725 745 6 1992 1000 950 989 7 1993 1050 1000 1010 1994 1125 1020 1025 9 1995 1210 1100 1109 10 1996 1300 1250 1275 11 1997 1500 1425 1475 12 1998 1550 1510 1500 13 1999 1580 1575 1580 14 2000 1600 1600 1590 15 2001 1730 1710 1725 16 2002 1800 1755 1775 17 2003 1930 1875 1850 18 2004 2000 1950 1900 19 2005 2015 2000 2010 20 2006 2035 2010 2015 21 2007 2045 2025 2025 22 2008 2075 2058 2050 23 2009 2150 2100 2100 24 2010 2225 2200 2105 25 2011 2400 2374 2300 26 2012 2450 2375 2325 27 2013 2475 2375 2375 28 2014 2800 2490 2400 29 2015 2900 2500 2800 30 2016 3050 2575 3000 31 2017 3025 2600 3025 32 2018 3100 2625 3075 33 2019 3150 2675 3100 34 2020 3275 2700 3125 35 2021 3300 2750 3150 36 Employee Satisfaction Office_Data Customers > A1 X fac A B c E F G H 1 2 3 Intercept Slope RSQ Standard Error Forecast Limit 2022 4 5 NYC Office Year Clients 1990 500 1991 750 1992 1000 1993 1050 1994 1125 6 Forecast High Low 7 8 9 1210 1995 1996 10 11 1997 1998 1300 1500 1550 1580 12 13 1999 2000 14 1600 15 2001 1730 16 2002 1800 1930 17 2003 18 2000 19 20 21 22 23 24 25 2004 2005 2006 2007 2008 2009 2010 2011 2012 2013 2014 2015 2035 2045 2075 2150 2225 2400 2450 2475 2800 2900 26 27 28 29 30 3050 31 2015 2016 2017 2018 2019 3025 32 33 3100 3150 3275 3300 34 2020 2021 35 36 Employee Satisfaction Office_Data Customers