

Answered step by step
Verified Expert Solution
Question
1 Approved Answer
what formulas are used in excel to solve the is problem. I keep getting error on my formula. cna someone show the excel sheet and
what formulas are used in excel to solve the is problem. I keep getting error on my formula. 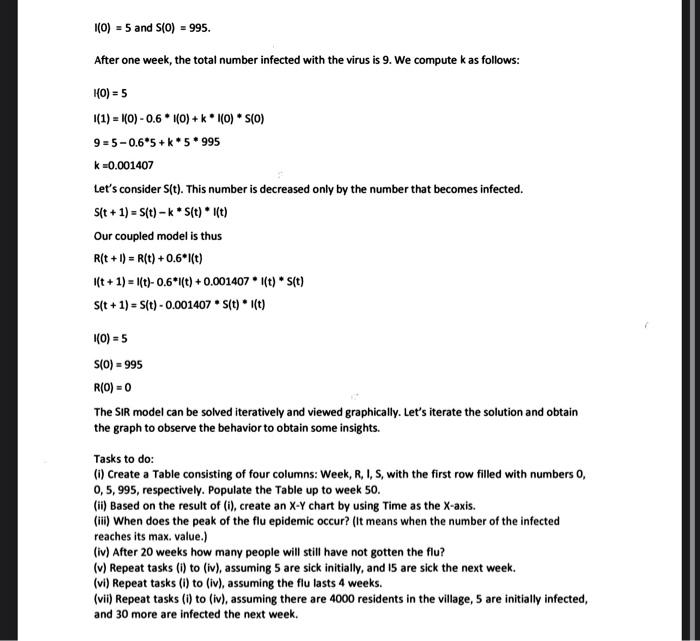
Consider a disease that is spreading throughout the United States, such as COVID-19. The Centers for Disease Control and Prevention is interested in knowing and experimenting with a model for this new disease before it actually becomes a real epidemic. Let us consider in a remote, closed village community, the village population is divided into three categories: susceptible (S), infected (I), and removed (R). We make the following assumptions for our model: - No one enters or leaves the community, and there is no contact outside the community. - Each person is susceptible S (able to catch this new flu); infected I (currently has the flu and can spread the flu); or removed R (already had the flu and will not get it again, which includes death). - Initially, every person is either S or I. - Once someone gets the flu this year, they cannot get the flu again. - The average length of the disease is 5/3 weeks ( 1 and 2/3 weeks), over which time the person is deemed infected and can spread the disease. - Our time period for the model will be per week. The model we will consider is called the SIR model. Let's assume the following definitions for our variables: S(t)= number in the population susceptible after period t I(t)= number infected after period t R(t)= number removed after period t Let's start our modeling process with R(t). Our assumption for the length of time someone has the flu is 5/3 weeks. Thus, 3/5 or 60% of the infected people will be removed each week: R(t+1)=R(t)+0.61(t) The value 0.6 is called the removal rate per week. It represents the proportion of the infected persons who are removed from infection each week. I(t) will have terms that both increase and decrease its amount over time. It is decreased by the number of people removed each week 0.6(t). It is increased by the number of susceptible people who come into contact with infected people and catch the disease: kS(t))I(t). We define k as the rate at which the disease is spread, or the transmission coefficient. We assume, initially, this rate k is a constant value that can be found from the initial conditions. Assume we have a population of 1000 residing in the village. Initially, the village nurse found 5 cases of infection were reported to the village clinic: I(0)=5andS(0)=995 After one week, the total number infected with the virus is 9 . We compute k as follows: K(0)=5 I(1)=I(0)0.6I(0)+kI(0)S(0)9=50.65+k5995k=0.001407 Let's consider S(t). This number is decreased only by the number that becomes infected. S(t+1)=S(t)kS(t)I(t) Our coupled model is thus R(t+1)=R(t)+0.61(t)I(t+1)=I(t)0.6I(t)+0.0014071(t)S(t)S(t+1)=S(t)0.001407S(t)1(t)I(0)=5S(0)=995R(0)=0 The SIR model can be solved iteratively and viewed graphically. Let's iterate the solution and obtain the graph to observe the behavior to obtain some insights. Tasks to do: (i) Create a Table consisting of four columns: Week, R, I, S, with the first row filled with numbers 0 , 0,5,995, respectively. Populate the Table up to week 50. (ii) Based on the result of (i), create an X - Y chart by using Time as the X-axis. (iii) When does the peak of the flu epidemic occur? (It means when the number of the infected reaches its max. value.) (iv) After 20 weeks how many people will still have not gotten the flu? (v) Repeat tasks (i) to (iv), assuming 5 are sick initially, and 15 are sick the next week. (vi) Repeat tasks (i) to (iv), assuming the flu lasts 4 weeks. (vii) Repeat tasks (i) to (iv), assuming there are 4000 residents in the village, 5 are initially infected, and 30 more are infected the next week cna someone show the excel sheet and also formulas on the excel sheet. 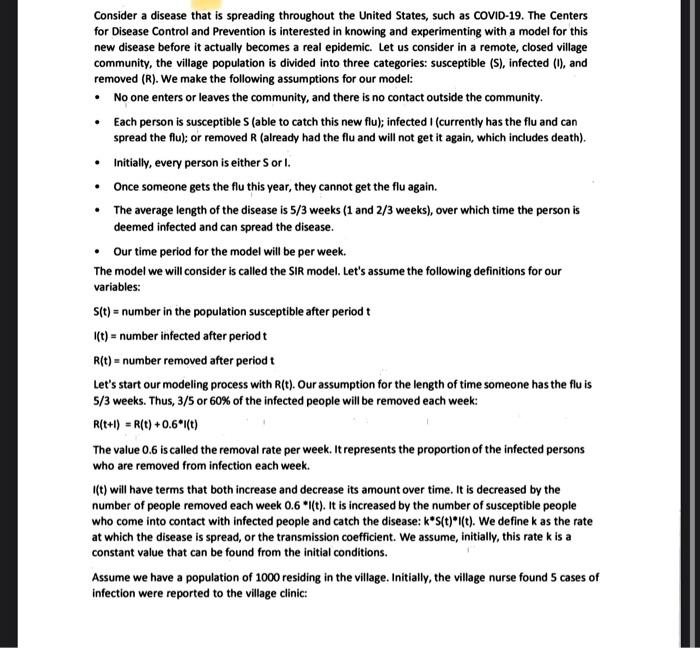
Step by Step Solution
There are 3 Steps involved in it
Step: 1

Get Instant Access to Expert-Tailored Solutions
See step-by-step solutions with expert insights and AI powered tools for academic success
Step: 2

Step: 3
Ace Your Homework with AI
Get the answers you need in no time with our AI-driven, step-by-step assistance
Get Started
Oracle Database 10g Insider Solutions
Authors: Arun R. Kumar, John Kanagaraj, Richard Stroupe
1st Edition
0672327910, 978-0672327919