Answered step by step
Verified Expert Solution
Question
1 Approved Answer
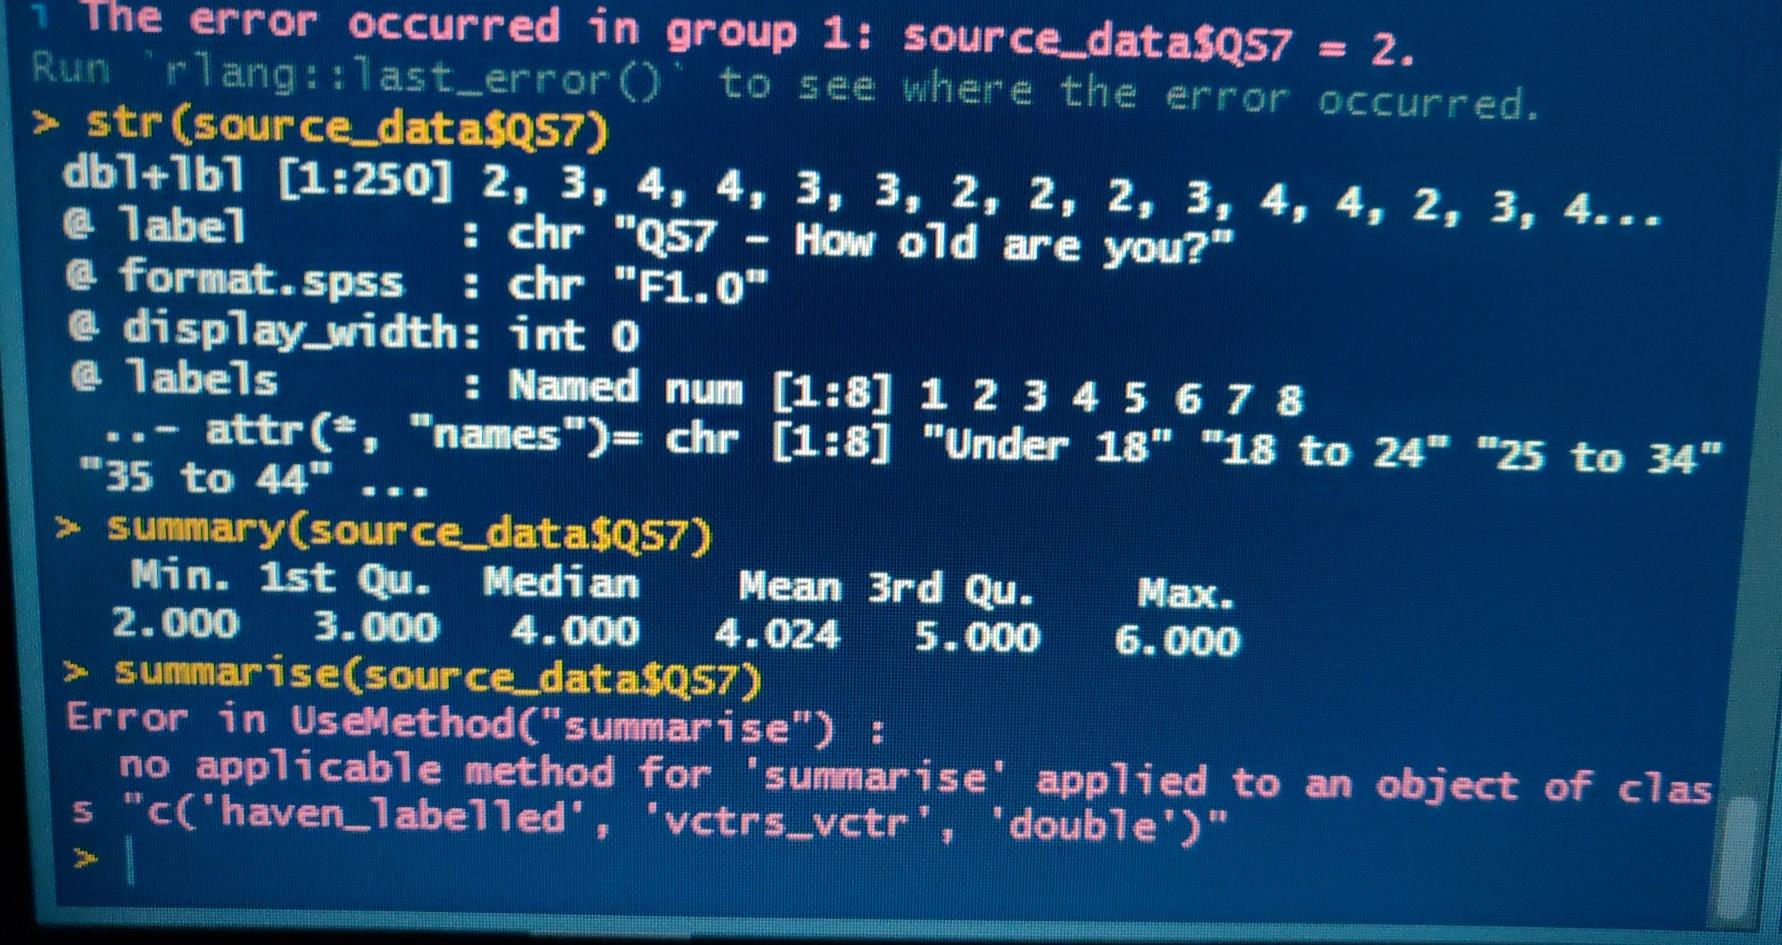
what function can I use in R programming in order to display frequency information (frequency, percentage, valid percentage, cumulative percent) on specific data from dataset?
what function can I use in R programming in order to display frequency information (frequency, percentage, valid percentage, cumulative percent) on specific data from dataset?

1 The error occurred in group 1: source_data$Q57 = 2. Run 'rlang: :last_error(' to see where the error occurred. > str (source_data$Q57) db1+1b1 (1:250] 2, 3, 4, 4, 3, 3, 2, 2, 2, 3, 4, 4, 2, 3, 4... @ label : chr "Q57 - How old are you?" @ format.spss : chr "F1.0" @ display_width: into @ labels : Named num (1:8] 1 2 3 4 5 6 7 8 ..- attr(e, "names")= chr [1:8] "Under 18" "18 to 24" "25 to 34" "35 to 44" > summary(source_data$Q57) Min. 1st Qu. Median Mean 3rd Qu. 2.000 3.000 4.000 5.000 6.000 summarise(source_data$257) Error in UseMethod("summarise"): no applicable method for 'summarise' applied to an object of clas s "cC'haven_labelled', 'vctrs_vctr', 'double')
Step by Step Solution
There are 3 Steps involved in it
Step: 1

Get Instant Access to Expert-Tailored Solutions
See step-by-step solutions with expert insights and AI powered tools for academic success
Step: 2

Step: 3

Ace Your Homework with AI
Get the answers you need in no time with our AI-driven, step-by-step assistance
Get Started


