Answered step by step
Verified Expert Solution
Question
1 Approved Answer
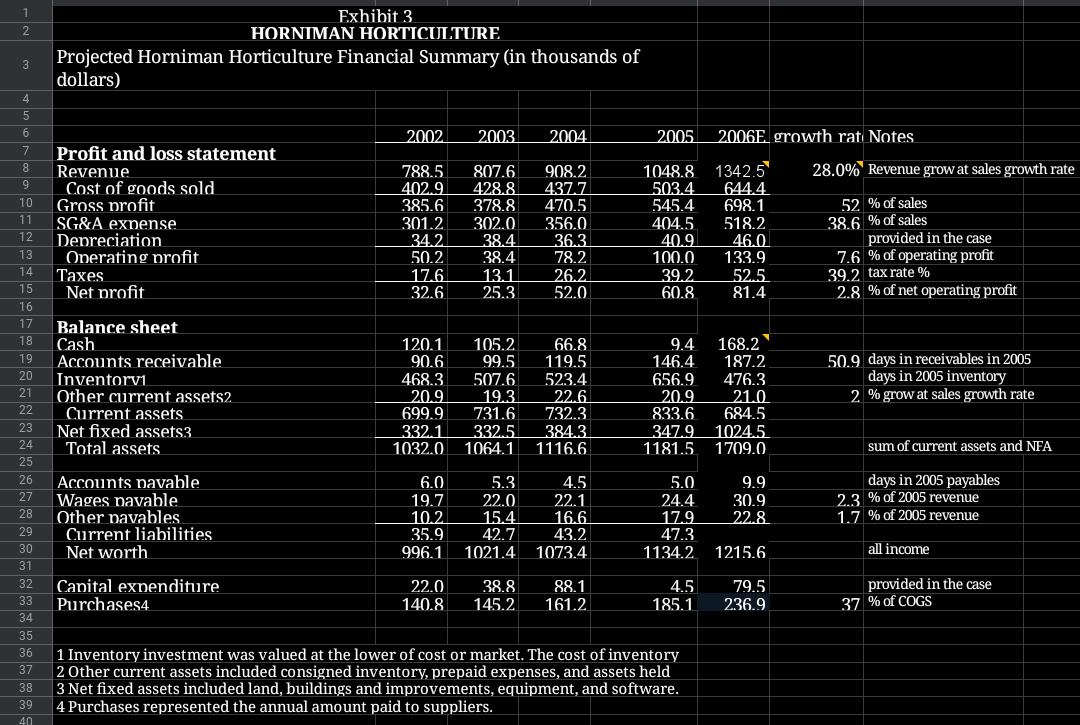
What growth rate is needed to maintain the same cash balance as 2005? Describe how you solved for the rate, and discuss your results. 1
What growth rate is needed to maintain the same cash balance as 2005? Describe how you solved for the rate, and discuss your results.

1 2 Exhibit 3 HORNIMAN HORTICULTURE Projected Horniman Horticulture Financial Summary (in thousands of dollars) 5 6 7 2002 2003 2004. 2005 2006E growth rat Notes 28.0% Revenue grow at sales growth rate 9 10 11 12 13 14 15 16 17 18 19 20 Profit and loss statement Revenue Cost of goods sold Gross profit SG&A expense Depreciation Operating profit Taxes Net profit 788.5 402.9 385.6 301.2 34.2 50.2 17.6. 32.6 807.6 428.8 378.8 302.0 38.4 38.4 13.1 25.3 908.2 437.7 470.5 356.0 36.3 78.2 26.2. 52.0 1048.8. 5034 545.4 404.5 40.9 100.0 39.2 60.8 1342.5 644.4. 698.1 518.2 46.0 133.9 52.5 81.4 52 % of sales 38.6 % of sales provided in the case 7.6 % of operating profit 39.2 tax rate % 2.8 % of net operating profit 146.4 Balance sheet Cash Accounts receivable Inventorvi Other current assets2 Current assets Net fixed assets3 Total assets 120.1 90.6 468.3 20.9 699.9 332.1 1032.0 105.2 99.5 507.6 19.3 731.6 332.5 1064.1 66.8 119.5 523.4. 22.6 732.3 384.3 1116.6 9.4. 168.2 187.2 656.9 476.3 20.9 21.0 833.6 684.5 347.9 1024.5. 1181.5 1709.0. 50.9 days in receivables in 2005 days in 2005 inventory 2 % grow at sales growth rate sum of current assets and NFA Accounts pavable Wages pavable Other pavables Current liabilities Net worth 6.0 19.7 10.2 35.9 996.1 5.3 22.0 15.4 42.7 1021.4 4.5 22.1 16.6 43.2 1073.4. 5.0 24.4. 17.9 47.3 1134.2 9.9 30.9. 22.8. days in 2005 payables 2.3 % of 2005 revenue 1.7 % of 2005 revenue 1215.6 all income 22 23 24 25 26 27 28 29 30 31 32 33 34 35 36 37 38 39 40 Capital expenditure Purchases4 22.0 140.8 38.8 145.2 88.1 161.2 4.5 185.1 79.5 236.9 provided in the case 37 % of COGS 1 Inventory investment was valued at the lower of cost or market. The cost of inventory 2 Other current assets included consigned inventory, prepaid expenses, and assets held 3 Net fixed assets included land, buildings and improvements, equipment, and software. 4 Purchases represented the annual amount paid to suppliers. 1 2 Exhibit 3 HORNIMAN HORTICULTURE Projected Horniman Horticulture Financial Summary (in thousands of dollars) 5 6 7 2002 2003 2004. 2005 2006E growth rat Notes 28.0% Revenue grow at sales growth rate 9 10 11 12 13 14 15 16 17 18 19 20 Profit and loss statement Revenue Cost of goods sold Gross profit SG&A expense Depreciation Operating profit Taxes Net profit 788.5 402.9 385.6 301.2 34.2 50.2 17.6. 32.6 807.6 428.8 378.8 302.0 38.4 38.4 13.1 25.3 908.2 437.7 470.5 356.0 36.3 78.2 26.2. 52.0 1048.8. 5034 545.4 404.5 40.9 100.0 39.2 60.8 1342.5 644.4. 698.1 518.2 46.0 133.9 52.5 81.4 52 % of sales 38.6 % of sales provided in the case 7.6 % of operating profit 39.2 tax rate % 2.8 % of net operating profit 146.4 Balance sheet Cash Accounts receivable Inventorvi Other current assets2 Current assets Net fixed assets3 Total assets 120.1 90.6 468.3 20.9 699.9 332.1 1032.0 105.2 99.5 507.6 19.3 731.6 332.5 1064.1 66.8 119.5 523.4. 22.6 732.3 384.3 1116.6 9.4. 168.2 187.2 656.9 476.3 20.9 21.0 833.6 684.5 347.9 1024.5. 1181.5 1709.0. 50.9 days in receivables in 2005 days in 2005 inventory 2 % grow at sales growth rate sum of current assets and NFA Accounts pavable Wages pavable Other pavables Current liabilities Net worth 6.0 19.7 10.2 35.9 996.1 5.3 22.0 15.4 42.7 1021.4 4.5 22.1 16.6 43.2 1073.4. 5.0 24.4. 17.9 47.3 1134.2 9.9 30.9. 22.8. days in 2005 payables 2.3 % of 2005 revenue 1.7 % of 2005 revenue 1215.6 all income 22 23 24 25 26 27 28 29 30 31 32 33 34 35 36 37 38 39 40 Capital expenditure Purchases4 22.0 140.8 38.8 145.2 88.1 161.2 4.5 185.1 79.5 236.9 provided in the case 37 % of COGS 1 Inventory investment was valued at the lower of cost or market. The cost of inventory 2 Other current assets included consigned inventory, prepaid expenses, and assets held 3 Net fixed assets included land, buildings and improvements, equipment, and software. 4 Purchases represented the annual amount paid to suppliers
Step by Step Solution
There are 3 Steps involved in it
Step: 1

Get Instant Access to Expert-Tailored Solutions
See step-by-step solutions with expert insights and AI powered tools for academic success
Step: 2

Step: 3

Ace Your Homework with AI
Get the answers you need in no time with our AI-driven, step-by-step assistance
Get Started


