

Question
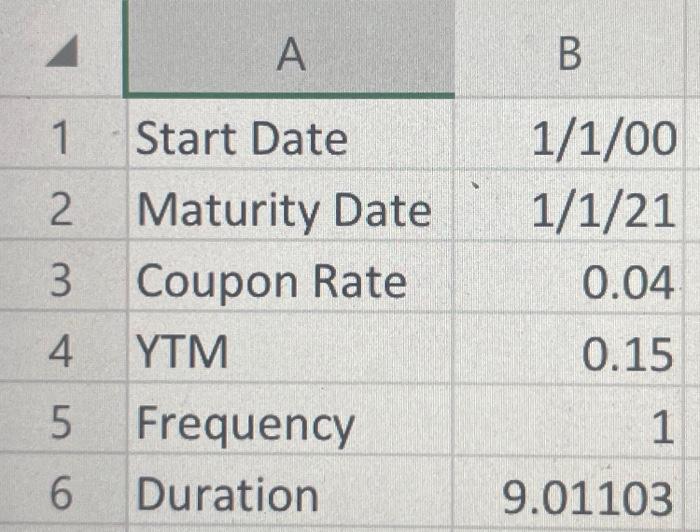
What happens to the duration of the bond if coupon changes? Illustrate with a graph of duration (y) vs coupon rate (x). Your graph should
What happens to the duration of the bond if coupon changes? Illustrate with a graph of duration (y) vs coupon rate (x). Your graph should increase in coupon rate until no meaningful changes occur by adding a higher coupon
Step by Step Solution
There are 3 Steps involved in it
Step: 1

Get Instant Access to Expert-Tailored Solutions
See step-by-step solutions with expert insights and AI powered tools for academic success
Step: 2

Step: 3
Ace Your Homework with AI
Get the answers you need in no time with our AI-driven, step-by-step assistance
Get Started
Restoring Demand In The World Economy Trade Finance And Technology
Authors: Joseph Halevi, Jean-Marc Fontaine
1st Edition
1858984580, 9781858984582