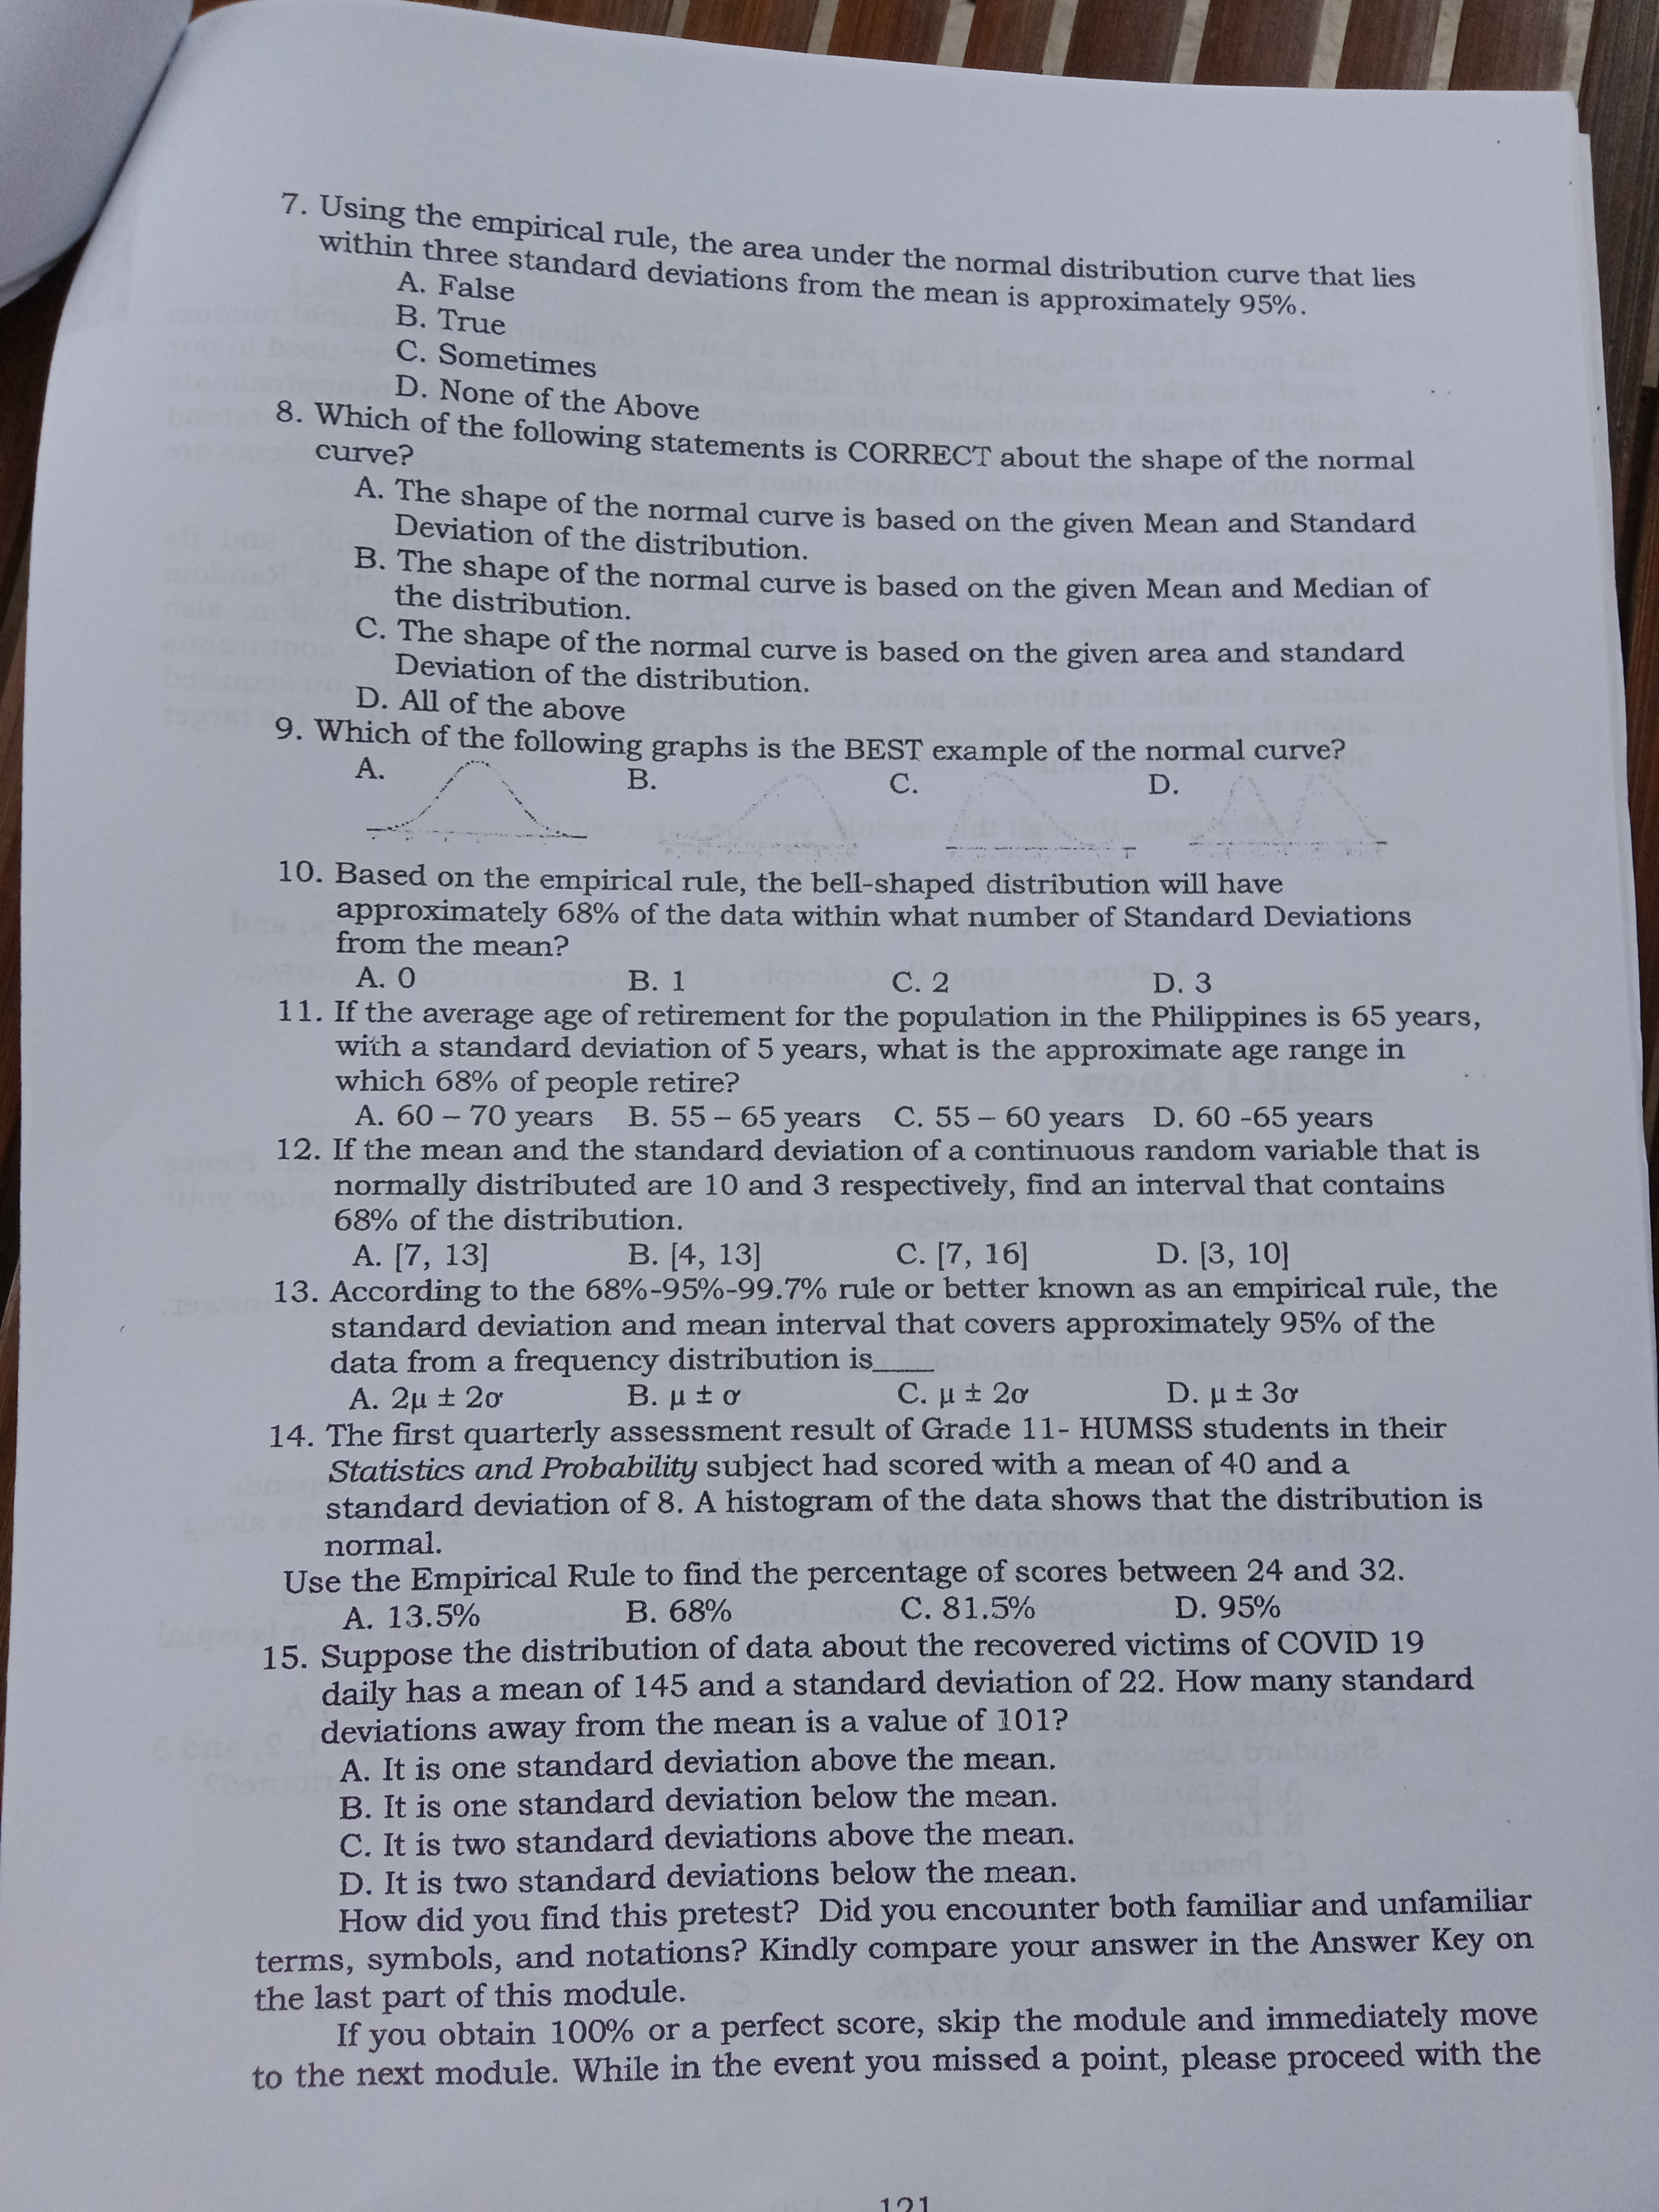
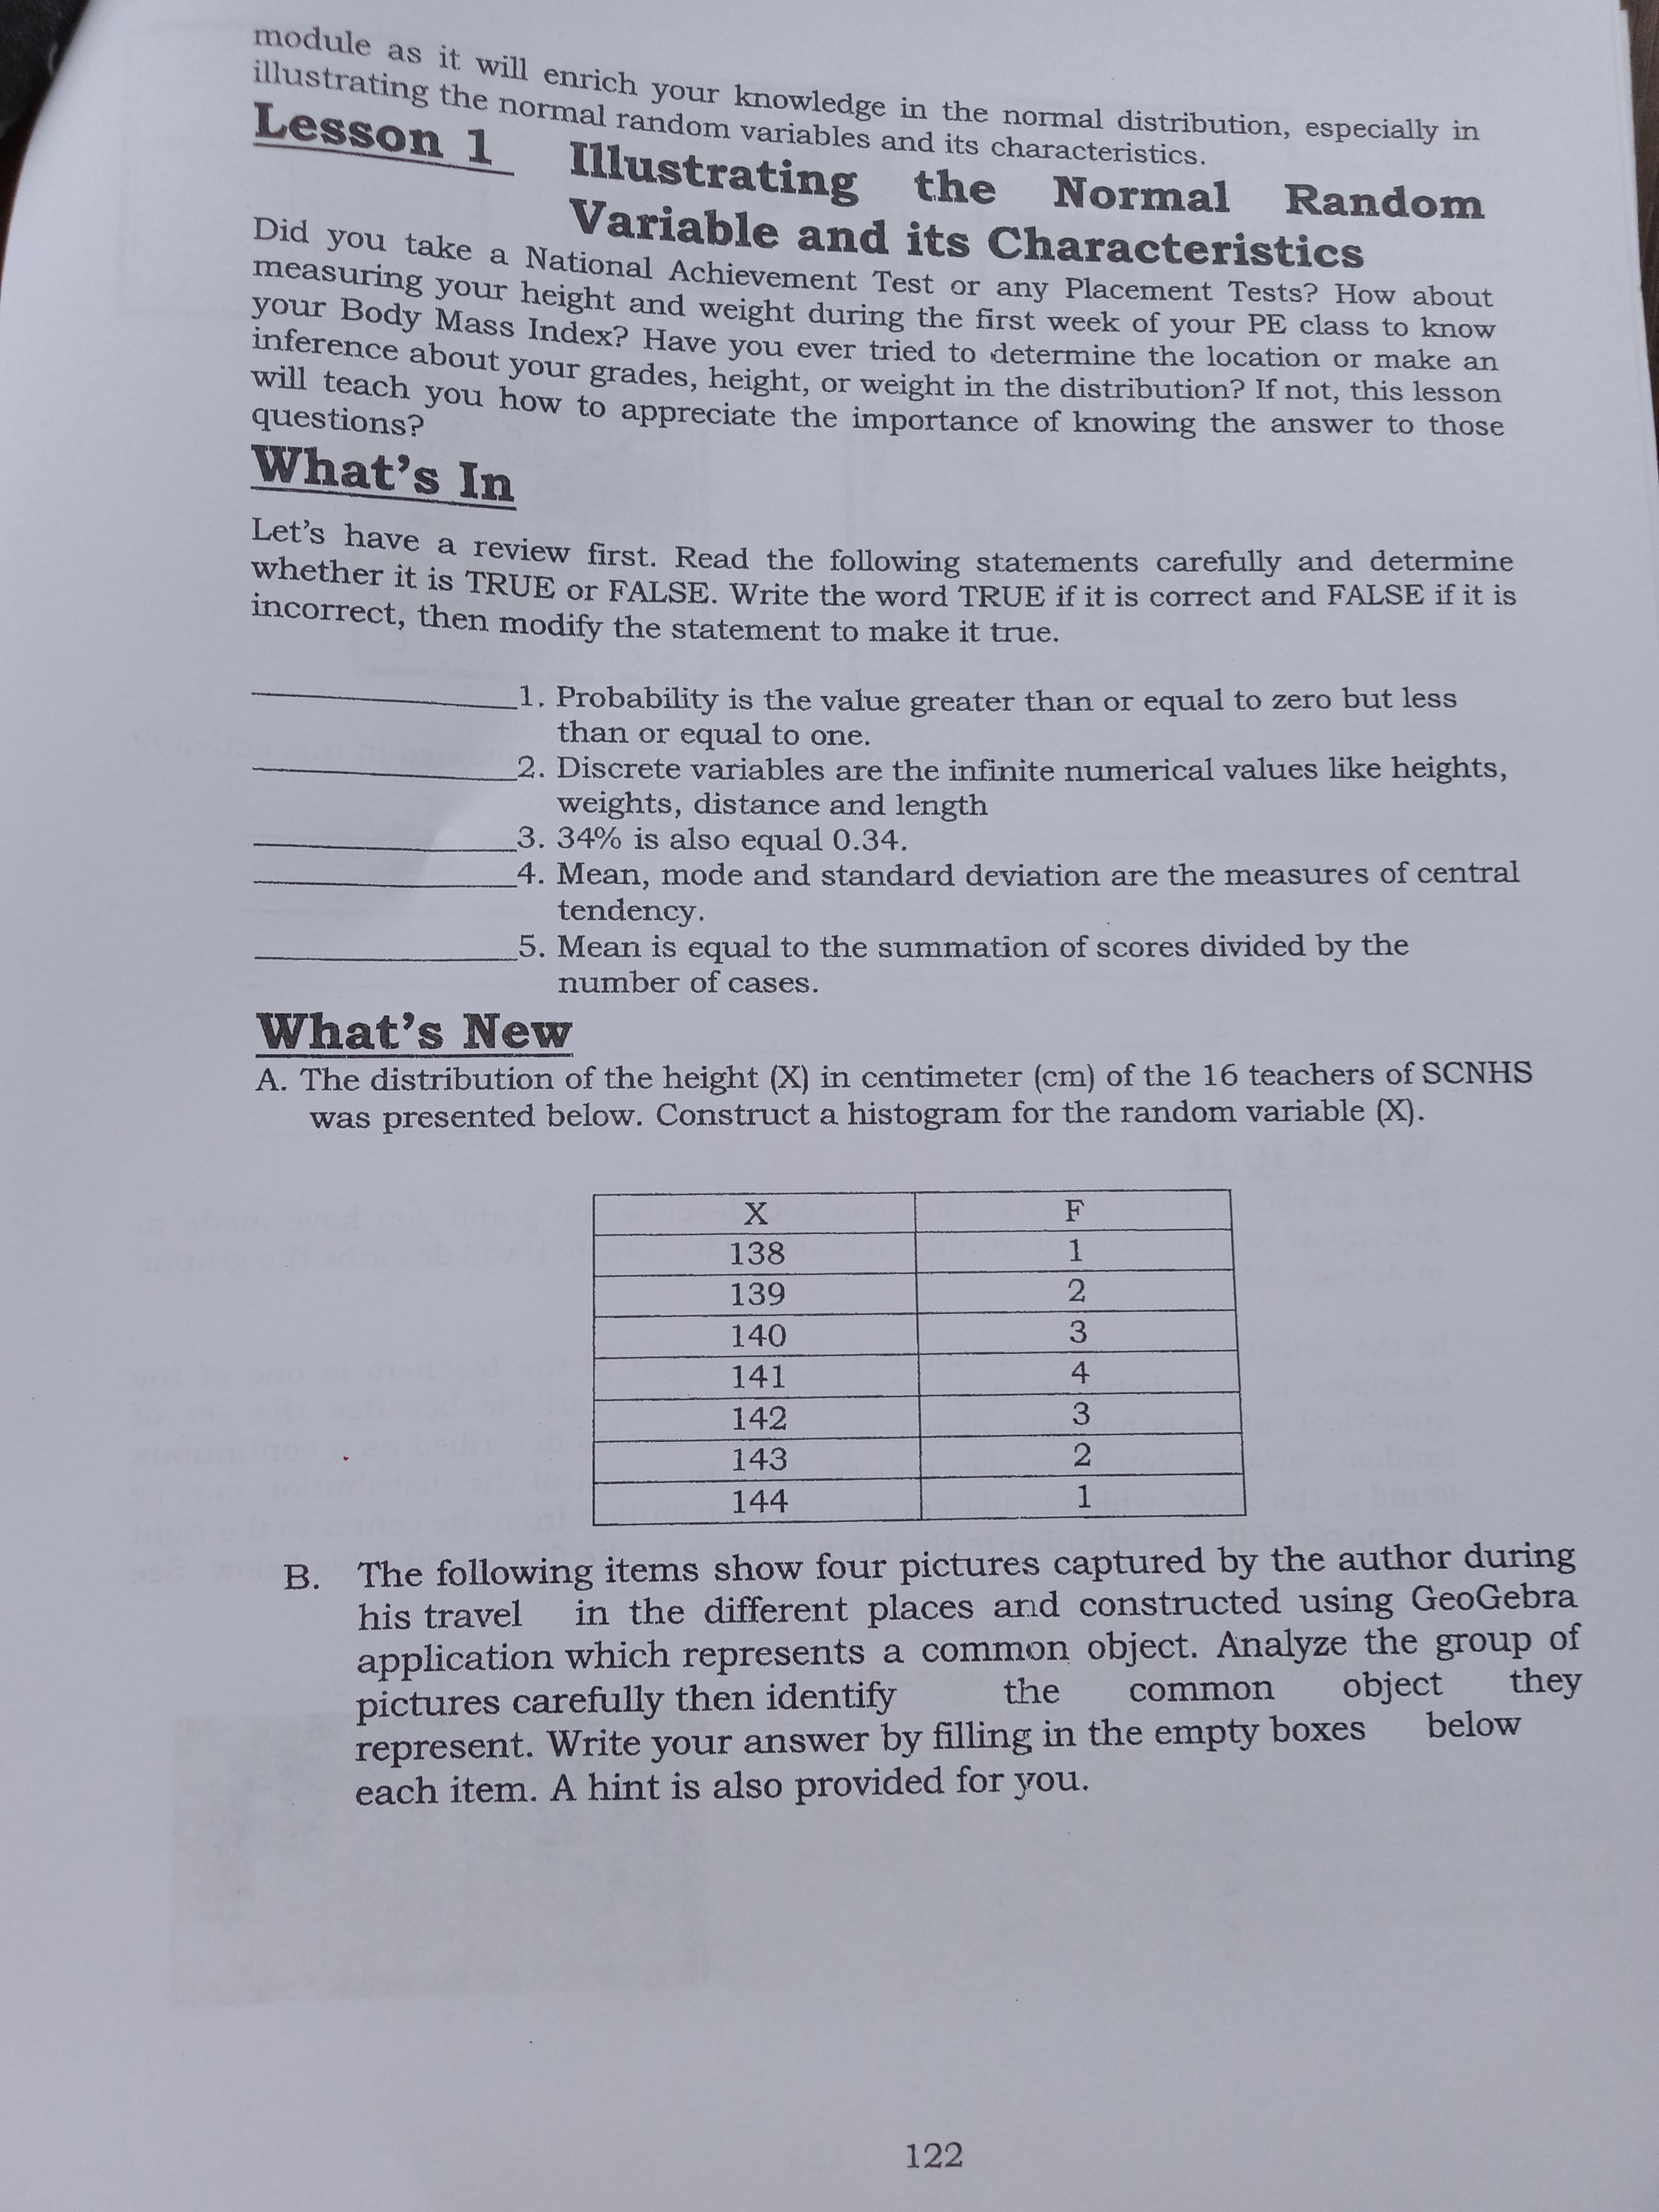
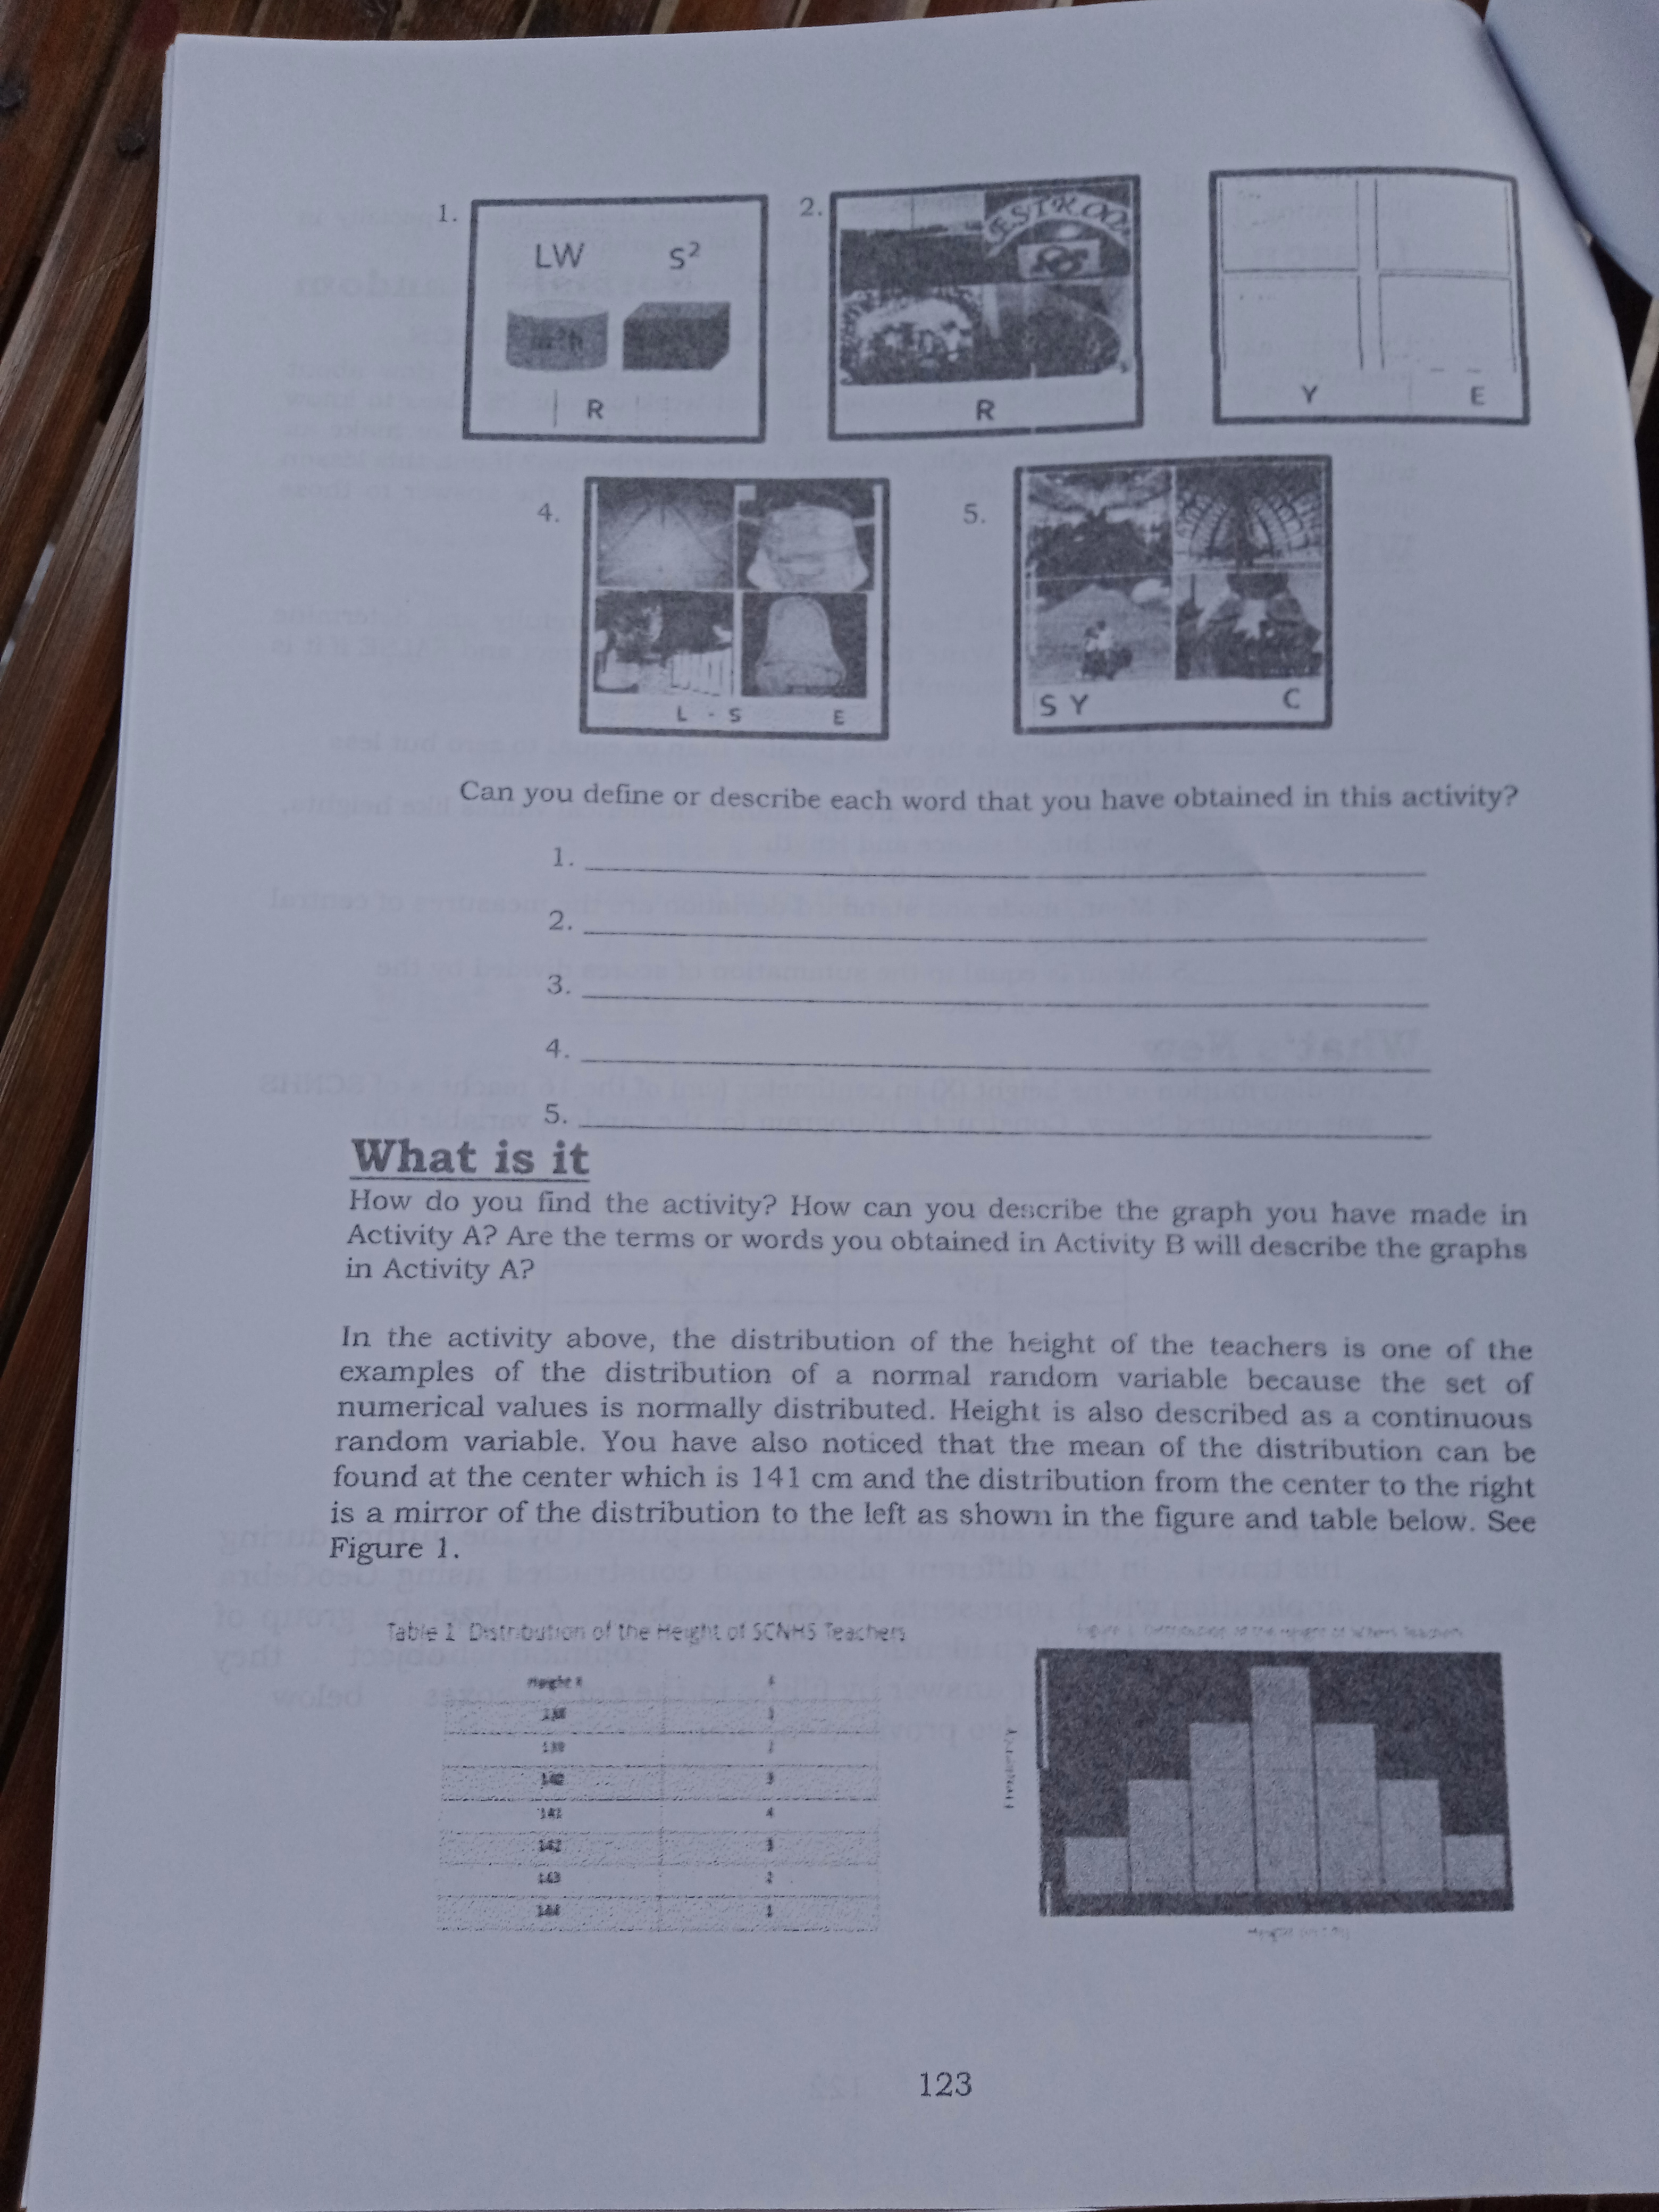
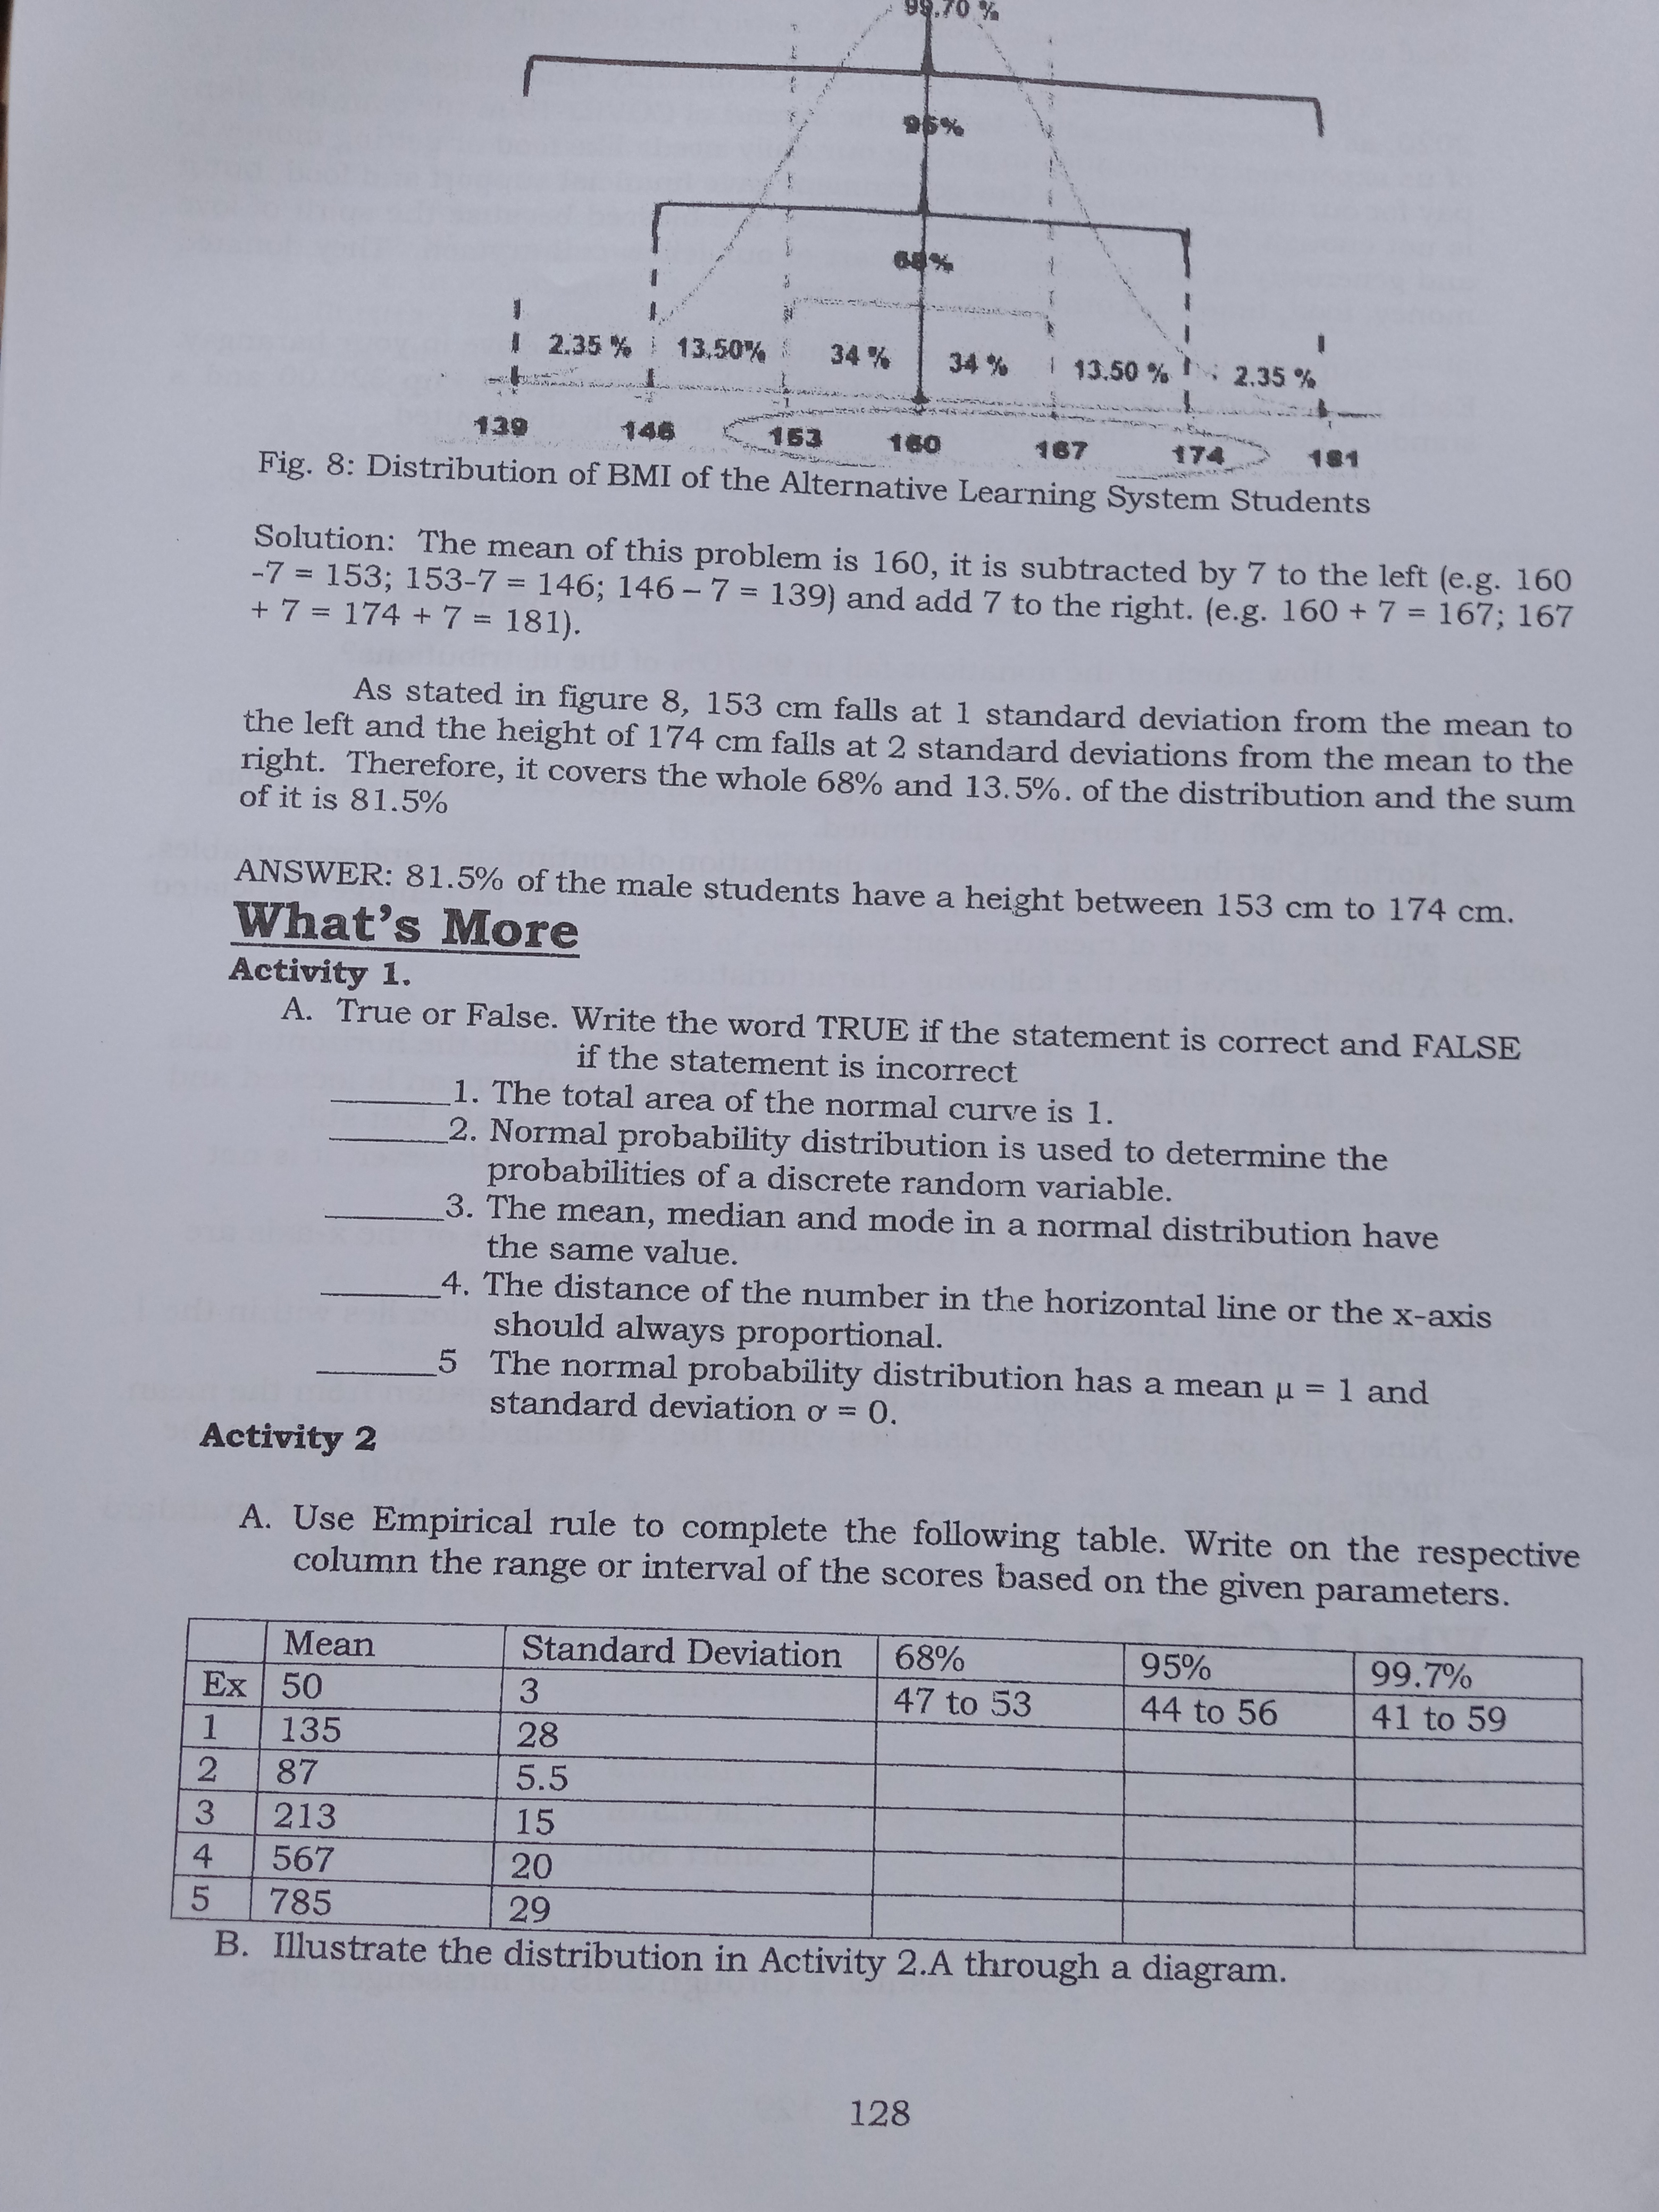

What I Need to Know This module was designed to help you as a learner to illustrate the normal random variable and its characteristics. You can also learn how a normal curve used in our daily life through the application of the concepts of an empirical rule to approximate the percentage of the random variables in the distribution. It is easy to understand the functions or uses of normal distribution because the examples and problems are based on the situations that we experience nowadays In a previous module, you have learned about the Random Variable and its Classification It also discussed the Probability Distributions of Discrete Random Variables. This time, you will focus on the Normal Probability Distribution, also called Normal Curve which is used to determine the probabilities of a continuous random variable. On the other hand, the knowledge, skills, and attitude you acquired about the percentage, mean and standard deviation is very useful to attain the target objectives of this module After going through this module, you are expected to: 1. define a normal random variable; 2. illustrate a normal random variable and its characteristics; and 3. state and apply the concepts of the empirical rule or 68%-95%- 99.7% of the distribution. What I Know Let us see how far you will go and how much you know about this pretest. Please answer all questions with your best and utmost honesty so that we can gauge your learning in the target competency of this lesson. Let's get started! Direction: Read and analyze each item carefully. Choose the letter of the best answer. Write the chosen letter on a separate sheet of paper. 1. The total area under the normal curve is A. - 1 B. O C. 0.5 D. 1 2. The normal curve is bell-shaped. A. False B. True C. Sometimes D. It depends 3. Which part of the normal curve is extended indefinitely in both directions along the horizontal axis, approaching but never touching it? A. center B. tail C. top D. spread 4. According to the property of a Normal Probability Distribution, the mean is equal to what measures of central tendency? A. median B. mode C. both A and B D. only A 5. Which of the following rules state that almost all data fall within the 1, 2, and 3 Standard Deviation of the Mean when the population is normally distributed? A. Empirical rule B. Lottery rule C. Pascal's triangle rule WO D. Sampling rule 6. Under the curve, the area to the left of the mean is A. 30% B. 47.72% C. 50% D. 68% 1207. Using the empirical rule, the area under the normal distribution curve that lies A. False within three standard deviations from the mean is approximately 95%. B. True C. Sometimes D. None of the Above curve? 8. Which of the following statements is CORRECT about the shape of the normal A. The shape of the normal curve is based on the given Mean and Standard Deviation of the distribution. B. The shape of the normal curve is based on the given Mean and Median of the distribution. C. The shape of the normal curve is based on the given area and standard Deviation of the distribution. D. All of the above 9. Which of the following graphs is the BEST example of the normal curve? A. B . C. D. 10. Based on the empirical rule, the bell-shaped distribution will have approximately 68% of the data within what number of Standard Deviations from the mean? A. 0 B. 1 C. 2 D. 3 1 1. If the average age of retirement for the population in the Philippines is 65 years, with a standard deviation of 5 years, what is the approximate age range in which 68% of people retire? A. 60 - 70 years B. 55 - 65 years C. 55 - 60 years D. 60 -65 years 12. If the mean and the standard deviation of a continuous random variable that is normally distributed are 10 and 3 respectively, find an interval that contains 68% of the distribution. A. [7, 13] B. [4, 13] C. [7, 16] D. [3, 10] 13. According to the 68%-95%-99.7% rule or better known as an empirical rule, the standard deviation and mean interval that covers approximately 95% of the data from a frequency distribution is_ A. 2u + 20 B. uto C. u * 20 D. M + 30 14. The first quarterly assessment result of Grade 11- HUMSS students in their Statistics and Probability subject had scored with a mean of 40 and a standard deviation of 8. A histogram of the data shows that the distribution is normal. Use the Empirical Rule to find the percentage of scores between 24 and 32. A. 13.5% B. 68% C. 81.5% D. 95% 15. Suppose the distribution of data about the recovered victims of COVID 19 daily has a mean of 145 and a standard deviation of 22. How many standard deviations away from the mean is a value of 101? A. It is one standard deviation above the mean. B. It is one standard deviation below the mean. C. It is two standard deviations above the mean. D. It is two standard deviations below the mean. How did you find this pretest? Did you encounter both familiar and unfamiliar terms, symbols, and notations? Kindly compare your answer in the Answer Key on the last part of this module. If you obtain 100% or a perfect score, skip the module and immediately move to the next module. While in the event you missed a point, please proceed with themodule as it will enrich your knowledge in the normal distribution, especially in illustrating the normal random variables and its characteristics. Lesson 1 Illustrating the Normal Random Variable and its Characteristics Did you take a National Achievement Test or any Placement Tests? How about measuring your height and weight during the first week of your PE class to know your Body Mass Index? Have you ever tried to determine the location or make an inference about your grades, height, or weight in the distribution? If not, this lesson questions? will teach you how to appreciate the importance of knowing the answer to those What's In Let's have a review first. Read the following statements carefully and determine whether it is TRUE or FALSE. Write the word TRUE if it is correct and FALSE if it is incorrect, then modify the statement to make it true. 1, Probability is the value greater than or equal to zero but less than or equal to one. 2. Discrete variables are the infinite numerical values like heights, weights, distance and length 3. 34% is also equal 0.34. 4. Mean, mode and standard deviation are the measures of central tendency. 5. Mean is equal to the summation of scores divided by the number of cases. What's New A. The distribution of the height (X) in centimeter (cm) of the 16 teachers of SCNHS was presented below. Construct a histogram for the random variable (X). X F 138 1 139 2 140 3 141 4 142 3 143 2 144 B. The following items show four pictures captured by the author during his travel in the different places and constructed using GeoGebra application which represents a common object. Analyze the group of pictures carefully then identify the common object they represent. Write your answer by filling in the empty boxes below each item. A hint is also provided for you. 12212 LW R R 4 5 Can you define or describe each word that you have obtained in this activity? 2 . 3. 5. What is it How do you find the activity? How can you describe the graph you have made in Activity A? Are the terms or words you obtained in Activity B will describe the graphs in Activity A? In the activity above, the distribution of the height of the teachers is one of the examples of the distribution of a normal random variable because the set of numerical values is normally distributed. Height is also described as a continuous random variable. You have also noticed that the mean of the distribution can be found at the center which is 141 cm and the distribution from the center to the right is a mirror of the distribution to the left as shown in the figure and table below. See Figure 1. Table 1 Distribution of the Height of SCAMS Teachers 12395%% 84%% 1 2:35 % : 13,50% 34% 34 % 1 13.50 % fi 2.35% 139 146 6 153 180 167 174 181 Fig. 8: Distribution of BMI of the Alternative Learning System Students Solution: The mean of this problem is 160, it is subtracted by 7 to the left (e.g. 160 -7 = 153; 153-7 = 146; 146-7 = 139) and add 7 to the right. (e.g. 160 + 7 = 167; 167 + 7 =174+7= 181). As stated in figure 8, 153 cm falls at 1 standard deviation from the mean to the left and the height of 174 cm falls at 2 standard deviations from the mean to the right. Therefore, it covers the whole 68% and 13.5%. of the distribution and the sum of it is 81.5% ANSWER: 81.5% of the male students have a height between 153 cm to 174 cm. What's More Activity 1. A. True or False. Write the word TRUE if the statement is correct and FALSE if the statement is incorrect 1. The total area of the normal curve is 1. 2. Normal probability distribution is used to determine the probabilities of a discrete random variable. 3. The mean, median and mode in a normal distribution have the same value. 4. The distance of the number in the horizontal line or the x-axis should always proportional. 5 The normal probability distribution has a mean u = 1 and standard deviation o = 0. Activity 2 A. Use Empirical rule to complete the following table. Write on the respective column the range or interval of the scores based on the given parameters. Mean Standard Deviation 68% 95% 99.7% EX 50 3 47 to 53 44 to 56 41 to 59 1 135 28 2 87 5.5 3 213 15 567 20 5 785 29 B. Illustrate the distribution in Activity 2.A through a diagram. 128Activity 3. Read and analyze the following problem to answer the question. The government launched Enhanced Community Quarantine on March 15, 2020, as a preventive measure to fight the spread of COVID-19 in the country. Many of us experienced difficulties in getting our daily needs like food or getting money to pay for our bills and rentals. Our government gave financial support and food, but it is not enough for the people. Fortunately, we are blessed because the spirit of love and generosity is still present in the heart of our fellow countrymen. They donated money, food, time, and other essential things. Suppose you and your friends conducted a donation-drive in your barangay. Each of the donors gave a certain amount with an average of Php 320.00 and a standard deviation of Php 60.00. Assuming, it is normally distributed, 1. What percentage of the distribution that the amount falls between Php. 260.00 and Php 380.00? 2. How much of the donations fall in 95% of the distributions? 3. How much of the donations fall in 99.70% of the distributions? What I Have Learned 1. A normal random variable is a set of a numerical value of continuous random variables which is normally distributed. 2. Normal Distribution is a probability distribution of continuous random variables. It also represents the probability, or the proportion, or the percentage associated with specific sets of measurement values. 3. A normal curve has the following characteristics: a. It should be bell-shaped and symmetric about its center. b. Both sides of the tails of a normal curve do not touch the horizontal axis. c. In the horizontal axis, use 0 at the center where the mean is located and use 1, 2, and 3 to the right and -1, -2 and -3 to the left. But still, remember there is an integral part of each number. However, it is not limited to the -3 and 3, it is extended indefinitely d. The distances between numbers in the horizontal line or the x-axis are always equal. 4. Empirical rule. This rule states that the data in the distribution lies within the 1, 2, and 3 of the standard deviation of the mean. 5. Sixty-eight percent (68%) of data lies within 1 standard deviation from the mean. 6. Ninety-five percent (95%) of data lies within the 2-standard deviation from the mean . 7. Ninety-nine and seven-tenths percent (99.70%) of data lies within the 3-standard deviation from the mean. What I Can Do MAKE A SURVEY Materials Needed 1. Cellphone 4. Calculator 2. Computer/ Laptop 5. Short Bond Paper 3. Pen/ pencil Instructions 1. Contact at least 20 of your classmates through SMS or messenger apps. 1292. Ask them for the result of their pre-test (What I Know) or pre-assessment of this module 3. Compute the mean and standard deviation of the collected data includes your own score . 4. Use the empirical rule, to answer the following questions a. What is the interval or range of scores falls within 68%? b. What is the interval or range of scores falls within 95%? c. What is the interval or range of scores falls within 99.7%? d. What is the interval or range of scores falls within 81.5%? e. In which interval away from the mean does your score belong? 5. Illustrate the distribution of the data you obtained from this survey through a diagram and put a mark on the interval where your score located. RUBRICS Assessment Direction: Read and analyze each item carefully. Choose the letter of the best answer. Write the chosen letter on a separate sheet of paper. 1. What is half of the total area of the normal curve? A. - 1 B. O C. 0.5 D. 1 2. What is the shape of a Normal Probability Distributions? A. bar B. bell C. circle D. line 3, Which part of a normal curve is asymptotic with the horizontal axis? A. center B. curve C. tail D. top 4. Which of the following statements is the characteristic of a normal probability distribution? A. The three measures of central tendency such as mean, mode, and median are equal. B. The three measures of central tendency such as mean, mode, and median are not equal C. The two measures of central tendency such as mean and mode are equal while the median is greater than zero D. The two measures of central tendency such as mean and mode are equal while the median is less than zero. 5. Which of the following statements describe the concepts of empirical rule? A. It states that the data in the distribution lies within one (1), two (2), and three (3) of the standard deviation from the mean are approximately 68%, 95% and 99.70%, respectively. B. It states that the data in the distribution lies within 100%. C. It states that the data in the distribution lies within one (1), two (2), and three (3) of the standard deviation from the mean are exactly 68%, 95% and 99.70%, respectively. D. It states that the data is asymmetric. 6. Under the curve, the area to the right of the mean is A. 30% B. 47.72% C. 50% D. 68% 7. Which of the following parameters is the basis of the shape of the normal curve? A. mean B. standard deviation C. Variance D. Both A and B 8. What is the equivalent of the mean of the following graph? A. 0 B. 1 C. 2 D. 3 1309. Using the empirical rule, the area under the normal distribution that lies within three standard deviations of the mean is approximately A. 68% B. 95% C. 97% D. 99.7% 10. Based on the empirical rule, the bell-shaped distribution will have approximately 68% of the data within what number of standard deviations of the mean? A. 0 B. 1 C. 2 D, 3 1 1. If the average age of retirement for the population in the Philippines is 65 years and with a standard deviation of 5 years, what is the approximate age range in which 95% of people retire? A. 60 - 70 years B. 55 - 65 years C. 55 - 60 years D. 55- 75 years 12. If the mean and the standard deviation of a continuous random variable that is normally distributed are 10 and 3, respectively, find an interval that contains 99.7% of the distribution. A. [7, 16] B. [4 , 16 ] C. [7, 16] D. [1, 19] 13. According to the 68%-95%-99.70% rule, the standard deviation and mean interval that covers approximately 99.70% of the data from a frequency distribution is A. 2u + 20 B. M1 0 C. M $ 20 D. u + 30 14. The first quarterly assessment result of Grade 11- STEM students in their Statistics and Probability subject had scored with a mean of 40 and a standard deviation of 8. A histogram of the data shows that the distribution is normal Use the Empirical Rule to find the percentage of scores between 24 and 48. A. 13.5% B. 68% C. 81.5% D. 95% 15. Suppose that distribution of data about the number of deaths of COVID 19 positive has a mean of 45 and a standard deviation of 18. How many standard deviations away from the mean is a value of 81? A. It is one standard deviation above the mean B. It is two standard deviations above the mean C. It is one standard deviation below the mean D. It is two standard deviations below the mean Additional Activities Read the following problems carefully. Apply the empirical rule and illustrate your answer through a diagram. 1. IQ scores of the ALS students in the Division of Quezon are normally distributed with a mean of 110 and a standard deviation of 10 a. What percent of the distribution falls within the IQ scores of 100 to 130? b. What percent of the distribution falls within the IQ scores of 90 to 140? 2. A normal distribution of data has a mean of 78 and a standard deviation of 9. a. What scores fall within 68% of the distribution? b. What scores fall within 95% of the distribution