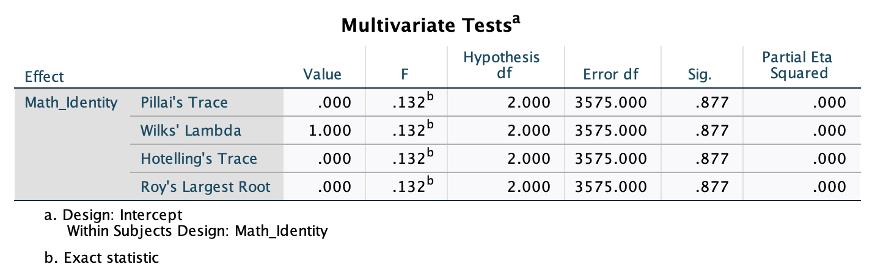
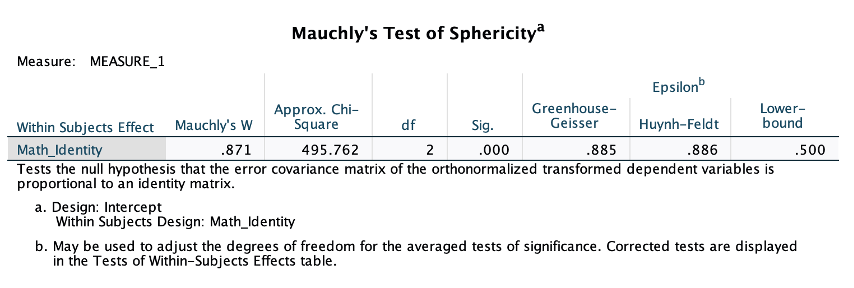
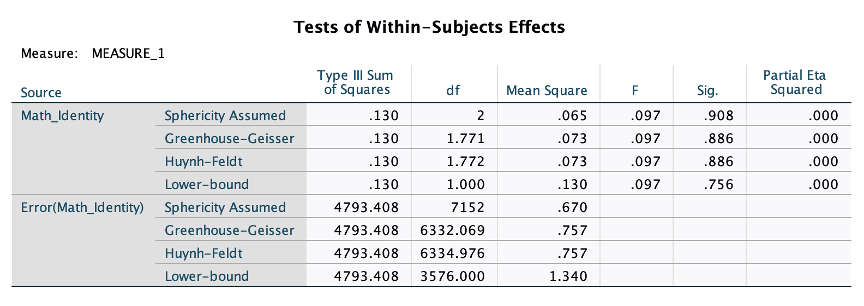
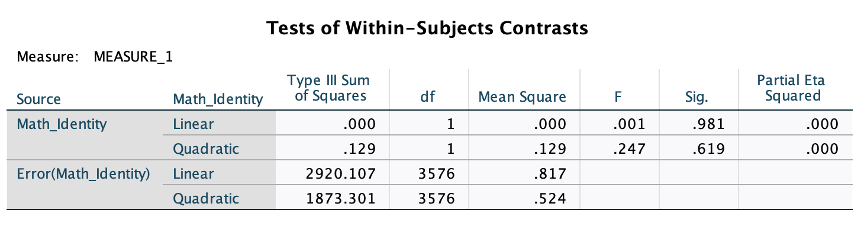
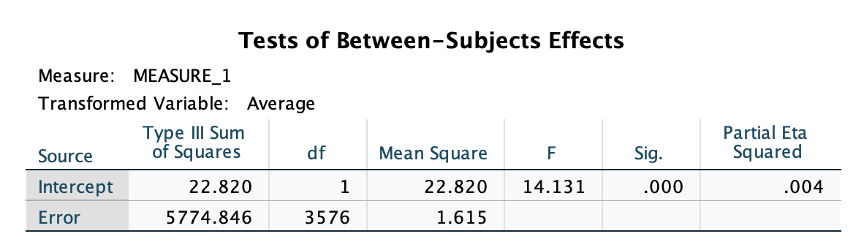
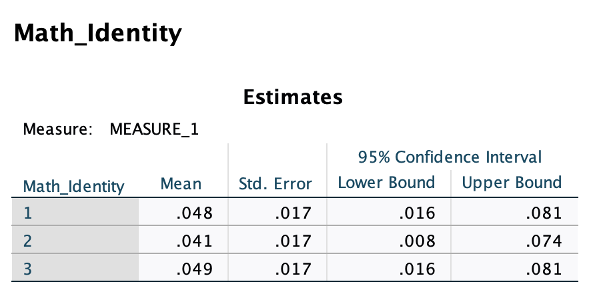
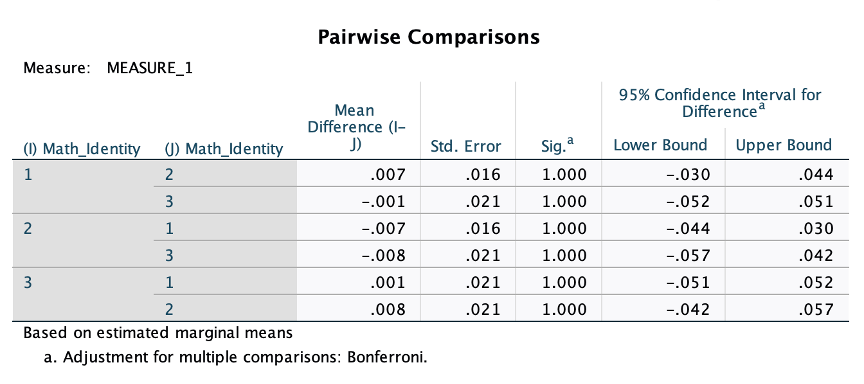
What is an example of a null hypothesis for this output
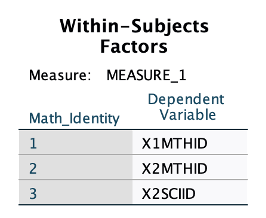
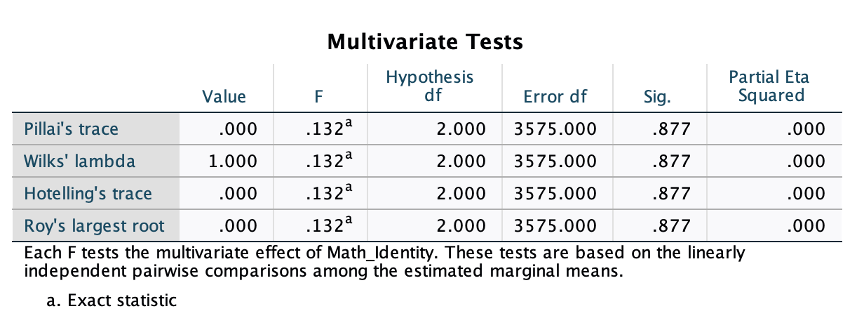
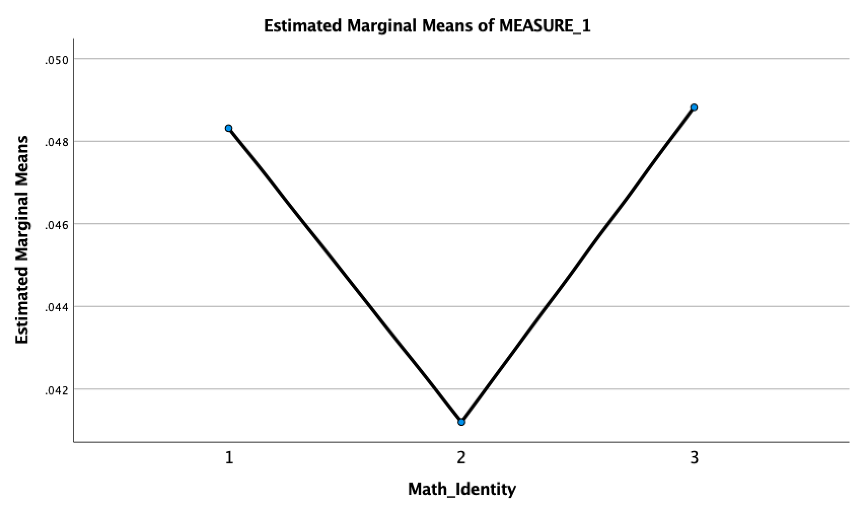
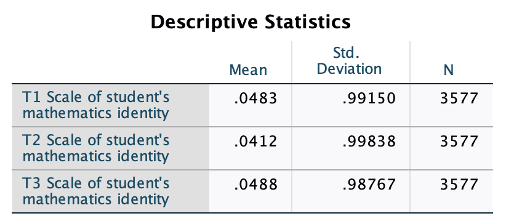
Within-Subjects Factors Measure: MEASURE 1 Dependent Math_Identity Variable 1 X1MTHID 2 X2MTHID X2 SCIIDMultivariate Tests Hypothesis Partial Eta Value F df Error df Sig. Squared Pillai's trace .000 .132a 2.000 3575.000 877 .000 Wilks' lambda 1.000 132a 2.000 3575.000 .877 .000 Hotelling's trace .000 132 2.000 3575.000 877 .000 Roy's largest root .000 . 132a 2.000 3575.000 877 .000 Each F tests the multivariate effect of Math_Identity. These tests are based on the linearly independent pairwise comparisons among the estimated marginal means. a. Exact statistic\fDescriptive Statistics Std. Mean Deviation N T1 Scale of student's .0483 .99150 3577 mathematics identity T2 Scale of student's .0412 .99838 3577 mathematics identity T3 Scale of student's .0488 98767 3577 mathematics identityMultivariate Testsa Hypothesis Partial Eta Effect Value F df Error df Sig Squared Math_Identity Pillai's Trace .000 .132 2.000 3575.000 .877 .000 Wilks' Lambda 1.000 .132 2.000 3575.000 .877 .000 Hotelling's Trace .000 .132 2.000 3575.000 .877 .000 Roy's Largest Root .000 132 2.000 3575.000 .877 .000 a. Design: Intercept Within Subjects Design: Math_Identity b. Exact statisticMauchly's Test of Sphericity Measure: MEASURE_1 Epsilon Approx. Chi- Greenhouse- Lower- Within Subjects Effect Mauchly's W Square df Sig. Geisser Huynh-Feldt bound Math_Identity .871 495.762 2 000 .885 .886 .500 Tests the null hypothesis that the error covariance matrix of the orthonormalized transformed dependent variables is proportional to an identity matrix. a. Design: Intercept Within Subjects Design: Math_Identity b. May be used to adjust the degrees of freedom for the averaged tests of significance. Corrected tests are displayed in the Tests of Within-Subjects Effects table.Tests of Within-Subjects Effects Measure: MEASURE 1 Type Ill Sum Partial Eta Source of Squares df Mean Square Sig. Squared Math_Identity Sphericity Assumed 130 2 .065 097 908 000 Greenhouse-Geisser .130 1.771 073 097 .886 000 Huynh-Feldt .130 1.772 .073 097 .886 000 Lower-bound .130 1.000 130 097 .756 000 Error(Math_Identity) Sphericity Assumed 4793.408 7152 .670 Greenhouse-Geisser 4793.408 6332.069 757 Huynh-Feldt 4793.408 6334.976 .757 Lower-bound 4793.408 3576.000 1.340Tests of Within-Subjects Contrasts Measure: MEASURE_1 Type Ill Sum Partial Eta Source Math_Identity of Squares df Mean Square F Sig. Squared Math_Identity Linear .000 1 .000 .001 981 .000 Quadratic .129 1 .129 .247 .619 .000 Error(Math_Identity) Linear 2920.107 3576 .817 Quadratic 1873.301 3576 .524Tests of Between-Subjects Effects Measure: MEASURE_1 Transformed Variable: Average Type Ill Sum Partial Eta Source of Squares df Mean Square F Sig. Squared Intercept 22.820 1 22.820 14.131 .000 .004 Error 5774.846 3576 1.615Math_Identity Estimates Measure: MEASURE_1 95% Confidence Interval Math_Identity Mean Std. Error Lower Bound Upper Bound 1 .048 .017 016 .081 2 .041 .017 .008 .074 3 049 .017 016 081Pairwise Comparisons Measure: MEASURE_1 95% Confidence Interval for Mean Difference Difference (1- (1) Math_Identity () Math_Identity J) Std. Error Sig a Lower Bound Upper Bound 1 2 007 .016 1.000 -.030 .044 3 -.001 .021 1.000 -.052 .051 2 H -.007 .016 1.000 -.044 030 -.008 .021 1.000 -.057 .042 1 .001 .021 1.000 -.051 .052 2 008 .021 1.000 -.042 .057 Based on estimated marginal means a. Adjustment for multiple comparisons: Bonferroni