

Answered step by step
Verified Expert Solution
Question
1 Approved Answer
What is Hightech's inventory turnover in 2019? (Used the end of year inventory number, not the average) e. 2.5x a. 8.0x b. 5.8x c. 3.9x
- What is Hightech's inventory turnover in 2019? (Used the end of year inventory number, not the average)
e. 2.5x
a. 8.0x
b. 5.8x
c. 3.9x
d. 4.8x
- What can you conclude Hightechs inventory management compared to the industry average?
a. The company manages inventory efficiently because its inventory turnover is higher than industry.
c. The company manages inventory poorly because its inventory turnover is higher than industry.
d. There inventory ratio is same as the industry.
e. None of the above.
b. The company hold excess inventory and some inventory might be obsolete.
27. What is Hightechs times-interest-earned(TIE) in 2019?
d. 5.0x
b. 3.0x
e. 6.0x
c. 4.0x
a. 2.0x
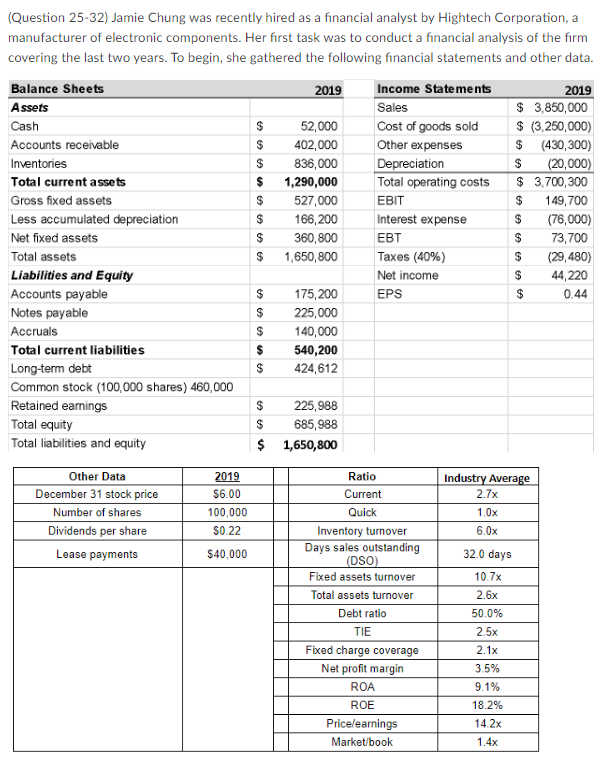
(Question 25-32) Jamie Chung was recently hired as a financial analyst by Hightech Corporation, a manufacturer of electronic components. Her first task was to conduct a financial analysis of the firm covering the last two years. To begin, she gathered the following financial statements and other data. Balance Sheets 2019 Income Statements 2019 Assets Sales $ 3,850,000 Cash $ Cost of goods sold $ (3,250,000) Accounts receivable $ Other expenses $ (430,300) Inventories $ Depreciation $ (20,000) Total current assets Total operating costs $ 3,700,300 Gross fixed assets EBIT $ 149,700 Less accumulated depreciation Interest expense $ (76,000) Net fixed assets EBT $ 73,700 Total assets Taxes (40%) $ (29,480) Liabilities and Equity Net income $ 44,220 Accounts payable EPS 0.44 Notes payable Accruals Total current liabilities Long-term debt Common stock (100,000 shares) 460,000 Retained earnings Total equity Total liabilities and equity Other Data 2019 December 31 stock price $6.00 Number of shares 100,000 Dividends per share $0.22 Lease payments $40,000 $ $ $ 68 69 $ $ $ $ (A $ $ $ $ $ $ es 52,000 402,000 836,000 1,290,000 527,000 166,200 360,800 1,650,800 175,200 225,000 140,000 540,200 424,612 225,988 685,988 1,650,800 Ratio Current Quick Inventory turnover Days sales outstanding (DSO) Fixed assets turnover Total assets turnover Debt ratio TIE Fixed charge coverage Net profit margin ROA ROE Price/earnings Market/book $ Industry Average 2.7x 1.0x 6.0x 32.0 days 10.7x 2.6x 50.0% 2.5x 2.1x 3.5% 9.1% 18.2% 14.2x 1.4x
Step by Step Solution
There are 3 Steps involved in it
Step: 1

Get Instant Access to Expert-Tailored Solutions
See step-by-step solutions with expert insights and AI powered tools for academic success
Step: 2

Step: 3
Ace Your Homework with AI
Get the answers you need in no time with our AI-driven, step-by-step assistance
Get Started