- What is the annual percentage change in fixed, floating, installment and mortgage loans? Remember to multiply by 4 for annual percentages.
- What is the annual percentage change in corporate and retail demand deposits, retail savings deposits, retail CDs and long-term retail deposits?
- Estimate the interest income of fixed rate, floating rate, installment and mortgage loans. Use the income statement and full balance sheet reports.
- Estimate the NIM, ROA and ROE. Net interest margin is defined as interest income minus interest expense over total average assets. Interest income should also include interest on all loans and government bonds. Interest expense should include interest on all deposits and discount window advances.
- You issued $50 million in 360-day negotiable CDs. The total negotiable CDs increased from $132 million in quarter 0 to $149 million in quarter 1. Explain.
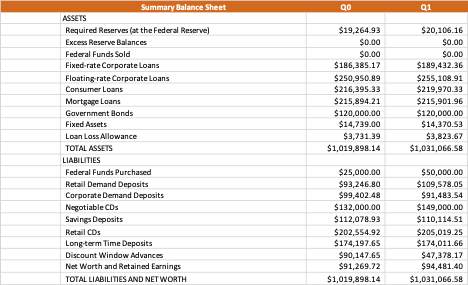
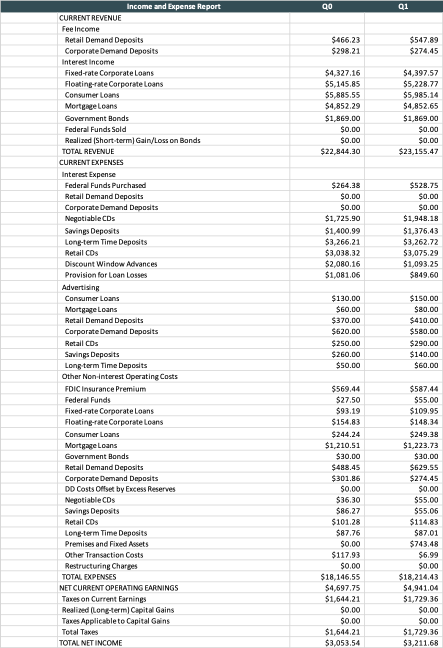
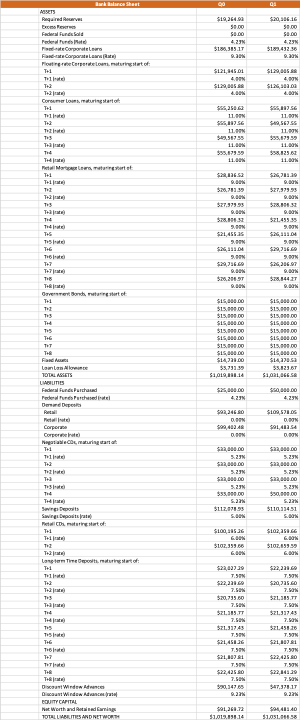
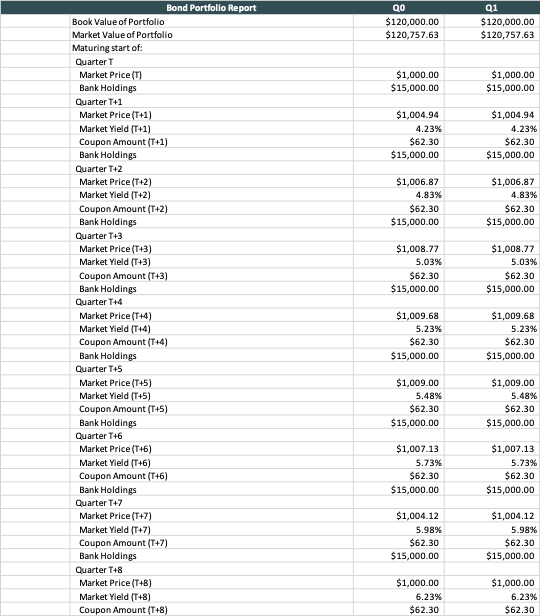
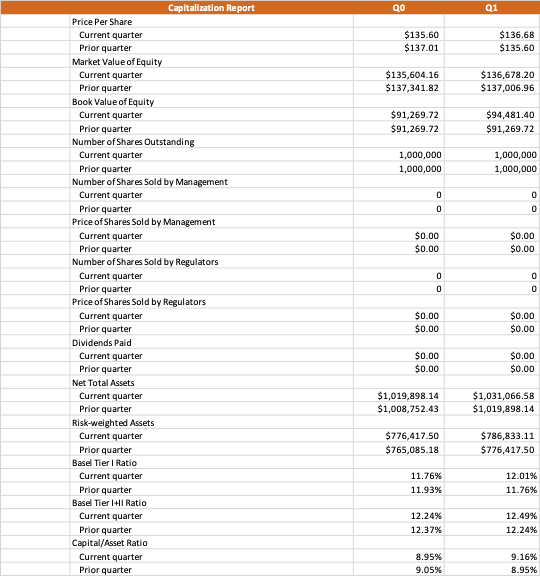
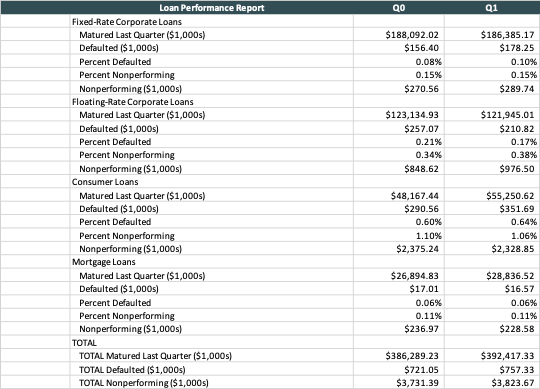
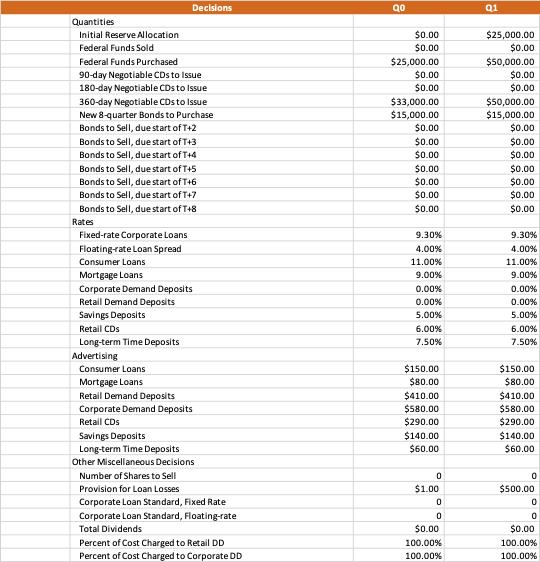
QO Q1 Summary Balance Sheet ASSETS Required Reserves (at the Federal Reserve) Excess Reserve Balances Federal Funds Sold Fixed-rate Corporate Loans Floating-rate Corporate Loans Consumer Loans Mortgage Loans Government Bonds Fixed Assets Loan Loss Allowance TOTAL ASSETS LIABILITIES Federal Funds Purchased Retail Demand Deposits Corporate Demand Deposits Negotiable CDs Savings Deposits Retail CDs Long-term Time Deposits Discount Window Advances Net Worth and Retained Earnings TOTAL LIABILITIES AND NET WORTH $19,264.93 $0.00 $0.00 $186,385.17 $250,950.89 $216,395.33 $215,894.21 $120,000.00 $14,739.00 $3,731.39 $1,019,898.14 $20,106.16 $0.00 $0.00 $199,432.36 $255,108,91 $219,970.33 $215,901.96 $120,000.00 $14,370.53 $3,823.67 $1,031,066.58 $25,000.00 $93,246.80 $99,402.48 $132,000.00 $112.078.93 $202,554.92 $174,197.65 $90,147.65 $91,269.72 $1,019,898.14 $50,000.00 $109,578.05 $91,483.54 $149,000.00 $110,114.51 $205,019.25 $174,011.66 $47,378.17 $94,481.40 $1,031,066,58 Qo 01 $466.23 $298.21 $547.89 $274,45 $4,327.16 $5,145.85 $5,885.55 $4,852.29 $1,869.00 $0.00 $0.00 $22,844.30 $4,397.57 $5,228.77 $5,985.14 $4,852.65 $1,869.00 $0.00 $0.00 $23,155.47 $264.38 $0.00 $0.00 $1,725.90 $1,400.99 $3,266,21 $3,038.32 $2,080.16 $1,081,06 $528.75 $0.00 $0.00 $1,948.18 $1,376.43 $3,262.72 $3,075.29 $1,093.25 $849.60 Income and Expense Report CURRENT REVENUE Fee Income Retail Demand Deposits Corporate Demand Deposits Interest Income Fixed-rate Corporate Loans Floating-rate Corporate Loans Consumer Loans Mortgage Loans Government Bonds Federal Funds Sold Realized Short-term) Gain/Loss on Bonds TOTAL REVENUE CURRENT EXPENSES Interest Expense Federal Funds Purchased Retail Demand Deposits Corporate Demand Deposits Negotiable CDs Savings Deposit Long-term Time Deposits Retail CDs Discount Window Advances Provision for Loan Losses Advertising Consumer Loans Mortgage Loans Retail Demand Deposits Corporate Demand Deposits Retail CDs Savings Deposits Long-term Time Deposits Other Non-interest Operating costs FDIC Insurance Premium Federal Funds Fixed-rate Corporate Loans Floating-rate Corporate Loans Consumer Loans Mortgage Loans Government Bonds Retail Demand Deposits Corporate Demand Deposits DO Costs Offset by Excess Reserves Negotiable CDs Savings Deposits Retail CDS Long-term Time Deposits Premises and Fixed Assets Other Transaction Costs Restructuring Charges TOTA. EXPENSES NET CURRENT OPERATING EARNINGS Taxes on Current Earnings Realized (Long-term) Capital Gains Taxes Applicable to Capital Gains Total Taxes TOTAL NET INCOME $130.00 $60.00 $370.00 $620.00 $250.00 $260.00 $50.00 $150.00 $80.00 $410.00 $580.00 $290.00 $140.00 $60.00 $569.44 $27.50 $93.19 $154.83 $244.24 $1,210.51 $30.00 $488,45 $301.86 $0.00 $36.30 $86.27 $101.28 $87.76 $0.00 $117.93 $0.00 $18,146.55 $4,697.75 $1,644,21 $0.00 $0.00 $1,644.21 $3,053.54 $587.44 $55.00 $109.95 $148.34 $249.38 $1,223.73 $30.00 $629.55 $274.45 $0.00 $55,00 $55.06 $114,83 $87.01 $743.48 $6.99 $0.00 $18,214,43 $4,941.04 $1,729.36 $0.00 $0.00 $1,729,36 $3,211.68 Bankace Sheet 03 Required: Federal Funes Sold Pederdures Corporate Fade Corporate Laansa Poetinget of $19.264.90 50.00 S.DO 4.29 $180.385.17 50.00 SH.DO 4.29 $13.432.30 T4L TOP1715 4. 55505 NO $129,00 4. ON $126,300.00 4.0 Corner tot TH $55,38756 11.00 TH T13 11.00 $85,81756 11.IN $4.50795 11.00 11.99 11.N $8.125.82 11.00% Meti Martinshot Tui THE TH $26 13.10 ON SANE ROON $20.78339 ON . 2008 ON SZL455.30 9.ON 9.00 $21,455 THE Torte THE Tube T7 526, 311.00 9.00 $29,7360 9.IN $286.97 ON $28.3442T $29,396.60 ON $20.00 ST BON TH8 T- Over Bonde TH TH $15,000.00 $15.000.00 $15.000.00 $150 DO $15,000.00 $15,000.00 $15.000.00 $15,000.00 S14100 TH SI5.000.00 $13.000.00 $15.000.00 SIS 30.00 $15.000.00 $15 000.00 $15.000.00 $15,000.00 SIA $5.823 BY $1,021, BGESA $1,019, 8.14 The FI Laina Aline TOTAL ASSETS LIABILITIES Federal Funds Partha Pedere Parts De NEZ DON $109,521.06 DOON S0142.54 ON Corper Corper Na, maana T1 DON $2,000.00 5.29 T2 $22,000.00 3.29 $22,000.00 5.29 $2,000.00 Te TH 5.29 $22,000.00 5.29 330,000.00 5.2 $110.33451 5.23 $LL2.078.95 Savings Depositsrat Metwi Ci nie start of Tui $100185 GON $102.333.86 GON $102 S. GON $102.159.99 GON TH Lapten Time Decoliture stato: TH 11 Ta TE T13 $22,021.30 T.5 T13 TIS THG TIe T+7 TUT THR 7.SON $20,735.00 7.50N 57.35. TT 7.50 $21.31243 T.IN $21,450X TSIN 121 BRI T.IN $22.00 7.50 $22, 2016 T. $20 as.co 7.SON SZLES TT 7.50 $21.337.43 7.SON 52145110 T.SON $21,81 TSIN $22.425.00 T.SON $22. 1439 7.50 $47.8.11 2.22% De ce Discount Window dance prasa LOUITY CAPITAL Net Worth and Retained Garnings TOTAL LIABILITIES AND NETWORTH 91 268.73 31.019,03814 S431D 51.051.000 58 Qo $120,000.00 $120,757.63 Q1 $120,000.00 $120,757.63 $1,000.00 $15,000.00 $1,000.00 $15,000.00 $1,004.94 4.23% $62.30 $15,000.00 $1,004.94 4.23% $62.30 $15,000.00 $1,006.87 4.83% $62.30 $15,000.00 $1,006.87 4.83% $62.30 $15,000.00 $1,008.77 5.03% $62.30 $15,000.00 $1,008.77 5.03% $62.30 $15,000.00 Bond Portfolio Report Book Value of Portfolio Market Value of Portfolio Maturing start of: Quarter T Market Price (1) Bank Holdings Quarter T+1 Market Price (T41) Market Yield (T+1) Coupon Amount (T+1) Bank Holdings Quarter T42 Market Price (T+2) Market Yield (T42) Coupon Amount (T+2) Bank Holdings Quarter T43 Market Price (T43) Market Yield (T+3) Coupon Amount (T+3) Bank Holdings Quarter T4 Market Price (T+4) Market Yield (T+4) Coupon Amount (T+4) Bank Holdings Quarter T45 Market Price (T45) Market Yield (T+5) Coupon Amount (T+5) Bank Holdings Quarter T+6 Market Price (T+6) Market Yield (T+6) Coupon Amount (T+6) Bank Holdings Quarter T+7 Market Price (T+7) Market Yield (T+7) Coupon Amount (T+7) Bank Holdings Quarter T+8 Market Price (T+8) Market Yield (T+8) Coupon Amount (T+8) $1,009.68 5.23% $62.30 $15,000.00 $1,009.68 5.23% $62.30 $15,000.00 $1,009.00 5.48% $62.30 $15,000.00 $1,009.00 5.48% $62.30 $15,000.00 $1,007.13 5.73% $62.30 $15,000.00 $1,007.13 5.73% $62.30 $15,000.00 $1,004.12 5.98% $62.30 $15,000.00 $1,004.12 5.98% $62.30 $15,000.00 $1,000.00 6.23% $62.30 $1,000.00 6.23% $62.30 Qo Q1 $135.60 $137.01 $136.68 $135.60 $135,604.16 $137,341.82 $136,678.20 $137,006.96 $91,269.72 $91,269.72 $94,481.40 $91,269.72 1,000,000 1,000,000 1,000,000 1,000,000 0 0 0 0 $0.00 $0.00 $0.00 $0.00 0 0 Capitalization Report Price Per Share Current quarter Prior quarter Market Value of Equity Current quarter Prior quarter Book Value of Equity Current quarter Prior quarter Number of Shares Outstanding Current quarter Prior quarter Number of Shares Sold by Management Current quarter Prior quarter Price of Shares Sold by Management Current quarter Prior quarter Number of shares Sold by Regulators Current quarter Prior quarter Price of shares Sold by Regulators Current quarter Prior quarter Dividends Paid Current quarter Prior quarter Net Total Assets Current quarter Prior quarter Risk-weighted Assets Current quarter Prior quarter Basel Tier Ratio Current quarter Prior quarter Basel Tier 1411 Ratio Current quarter Prior quarter Capital/Asset Ratio Current quarter Prior quarter 0 0 $0.00 $0.00 $0.00 $0.00 $0.00 $0.00 $0.00 $0.00 $1,019,898.14 $1,008,752.43 $1,031,066.58 $1,019,898.14 $776,417.50 $765,085.18 $786,833.11 $776,417.50 11.76% 11.93% 12.01% 11.76% 12.24% 12.37% 12.49% 12.24% 8.95% 9.05% 9.16% 8.95% Qo Q1 $188,092.02 $156.40 0.08% 0.15% $270.56 $186,385.17 $178.25 0.10% 0.15% $289.74 $123,134.93 $257.07 0.21% 0.34% $848.62 $121,945.01 $210.82 0.17% 0.38% $976.50 Loan Performance Report Fixed-Rate Corporate Loans Matured Last Quarter ($1,000s) Defaulted ($1,000s) Percent Defaulted Percent Nonperforming Nonperforming ($1,000s) Floating-Rate Corporate Loans Matured Last Quarter ($1,000s) Defaulted ($1,000) Percent Defaulted Percent Nonperforming Nonperforming ($1,000) Consumer Loans Matured Last Quarter ($1,000s) Defaulted ($1,000) Percent Defaulted Percent Nonperforming Nonperforming ($1,000s) Mortgage Loans Matured Last Quarter ($1,000s) Defaulted ($1,000s) Percent Defaulted Percent Nonperforming Nonperforming ($1,000s) TOTAL TOTAL Matured Last Quarter ($1,000s) TOTAL Defaulted ($1,000s) TOTAL Nonperforming ($1,000s) $48,167.44 $290.56 0.60% 1.10% $2,375.24 $55,250.62 $351.69 0.64% 1.06% $2,328.85 $26,894.83 $17.01 0.06% 0.11% $236.97 $28,836.52 $16.57 0.06% 0.11% $228.58 $386,289.23 $721.05 $3,731.39 $392,417.33 $757.33 $3,823.67 Qo Q1 $0.00 $0.00 $25,000.00 $0.00 $0.00 $33,000.00 $15,000.00 $0.00 $0.00 $0.00 $0.00 $0.00 $0.00 $0.00 $25,000.00 $0.00 $50,000.00 $0.00 $0.00 $50,000.00 $15,000.00 $0.00 $0.00 $0.00 $0.00 $0.00 $0.00 $0.00 Decisions Quantities Initial Reserve Allocation Federal Funds Sold Federal Funds Purchased 90-day Negotiable CDs to Issue 180-day Negotiable CDs to Issue 360-day Negotiable CDs to Issue New 8-quarter Bonds to Purchase Bonds to Sell, due start of T+2 Bonds to Sell, due start ofT+3 Bonds to Sell, due start of T+4 Bonds to Sell, due start of T45 Bonds to Sell, due start of T+6 Bonds to Sell, due start of T+7 Bonds to Sell, due start ofT+8 Rates Fixed-rate Corporate Loans Floating rate Loan Spread Consumer Loans Mortgage Loans Corporate Demand Deposits Retail Demand Deposits Savings Deposits Retail CDs Long-term Time Deposits Advertising Consumer Loans Mortgage Loans Retail Demand Deposits Corporate Demand Deposits Retail CDs Savings Deposits Long-term Time Deposits Other Miscellaneous Decisions Number of Shares to Sell Provision for Loan Losses Corporate Loan Standard, Fixed Rate Corporate Loan Standard, Floating-rate Total Dividends Percent of Cost Charged to Retail DD Percent of Cost Charged to Corporate DD 9.30% 4.00% 11.00% 9.00% 0.00% 0.00% 5.00% 6.00% 7.50% 9.30% 4.00% 11.00% 9.00% 0.00% 0.00% 5.00% 6.00% 7.50% $150.00 $80.00 $410.00 $580.00 $290.00 $140.00 $60.00 $150.00 $80.00 $410.00 $580.00 $290.00 $140.00 $60.00 0 $500.00 0 0 $1.00 0 0 $0.00 100.00% 100.00% 0 $0.00 100.00% 100.00% QO Q1 Summary Balance Sheet ASSETS Required Reserves (at the Federal Reserve) Excess Reserve Balances Federal Funds Sold Fixed-rate Corporate Loans Floating-rate Corporate Loans Consumer Loans Mortgage Loans Government Bonds Fixed Assets Loan Loss Allowance TOTAL ASSETS LIABILITIES Federal Funds Purchased Retail Demand Deposits Corporate Demand Deposits Negotiable CDs Savings Deposits Retail CDs Long-term Time Deposits Discount Window Advances Net Worth and Retained Earnings TOTAL LIABILITIES AND NET WORTH $19,264.93 $0.00 $0.00 $186,385.17 $250,950.89 $216,395.33 $215,894.21 $120,000.00 $14,739.00 $3,731.39 $1,019,898.14 $20,106.16 $0.00 $0.00 $199,432.36 $255,108,91 $219,970.33 $215,901.96 $120,000.00 $14,370.53 $3,823.67 $1,031,066.58 $25,000.00 $93,246.80 $99,402.48 $132,000.00 $112.078.93 $202,554.92 $174,197.65 $90,147.65 $91,269.72 $1,019,898.14 $50,000.00 $109,578.05 $91,483.54 $149,000.00 $110,114.51 $205,019.25 $174,011.66 $47,378.17 $94,481.40 $1,031,066,58 Qo 01 $466.23 $298.21 $547.89 $274,45 $4,327.16 $5,145.85 $5,885.55 $4,852.29 $1,869.00 $0.00 $0.00 $22,844.30 $4,397.57 $5,228.77 $5,985.14 $4,852.65 $1,869.00 $0.00 $0.00 $23,155.47 $264.38 $0.00 $0.00 $1,725.90 $1,400.99 $3,266,21 $3,038.32 $2,080.16 $1,081,06 $528.75 $0.00 $0.00 $1,948.18 $1,376.43 $3,262.72 $3,075.29 $1,093.25 $849.60 Income and Expense Report CURRENT REVENUE Fee Income Retail Demand Deposits Corporate Demand Deposits Interest Income Fixed-rate Corporate Loans Floating-rate Corporate Loans Consumer Loans Mortgage Loans Government Bonds Federal Funds Sold Realized Short-term) Gain/Loss on Bonds TOTAL REVENUE CURRENT EXPENSES Interest Expense Federal Funds Purchased Retail Demand Deposits Corporate Demand Deposits Negotiable CDs Savings Deposit Long-term Time Deposits Retail CDs Discount Window Advances Provision for Loan Losses Advertising Consumer Loans Mortgage Loans Retail Demand Deposits Corporate Demand Deposits Retail CDs Savings Deposits Long-term Time Deposits Other Non-interest Operating costs FDIC Insurance Premium Federal Funds Fixed-rate Corporate Loans Floating-rate Corporate Loans Consumer Loans Mortgage Loans Government Bonds Retail Demand Deposits Corporate Demand Deposits DO Costs Offset by Excess Reserves Negotiable CDs Savings Deposits Retail CDS Long-term Time Deposits Premises and Fixed Assets Other Transaction Costs Restructuring Charges TOTA. EXPENSES NET CURRENT OPERATING EARNINGS Taxes on Current Earnings Realized (Long-term) Capital Gains Taxes Applicable to Capital Gains Total Taxes TOTAL NET INCOME $130.00 $60.00 $370.00 $620.00 $250.00 $260.00 $50.00 $150.00 $80.00 $410.00 $580.00 $290.00 $140.00 $60.00 $569.44 $27.50 $93.19 $154.83 $244.24 $1,210.51 $30.00 $488,45 $301.86 $0.00 $36.30 $86.27 $101.28 $87.76 $0.00 $117.93 $0.00 $18,146.55 $4,697.75 $1,644,21 $0.00 $0.00 $1,644.21 $3,053.54 $587.44 $55.00 $109.95 $148.34 $249.38 $1,223.73 $30.00 $629.55 $274.45 $0.00 $55,00 $55.06 $114,83 $87.01 $743.48 $6.99 $0.00 $18,214,43 $4,941.04 $1,729.36 $0.00 $0.00 $1,729,36 $3,211.68 Bankace Sheet 03 Required: Federal Funes Sold Pederdures Corporate Fade Corporate Laansa Poetinget of $19.264.90 50.00 S.DO 4.29 $180.385.17 50.00 SH.DO 4.29 $13.432.30 T4L TOP1715 4. 55505 NO $129,00 4. ON $126,300.00 4.0 Corner tot TH $55,38756 11.00 TH T13 11.00 $85,81756 11.IN $4.50795 11.00 11.99 11.N $8.125.82 11.00% Meti Martinshot Tui THE TH $26 13.10 ON SANE ROON $20.78339 ON . 2008 ON SZL455.30 9.ON 9.00 $21,455 THE Torte THE Tube T7 526, 311.00 9.00 $29,7360 9.IN $286.97 ON $28.3442T $29,396.60 ON $20.00 ST BON TH8 T- Over Bonde TH TH $15,000.00 $15.000.00 $15.000.00 $150 DO $15,000.00 $15,000.00 $15.000.00 $15,000.00 S14100 TH SI5.000.00 $13.000.00 $15.000.00 SIS 30.00 $15.000.00 $15 000.00 $15.000.00 $15,000.00 SIA $5.823 BY $1,021, BGESA $1,019, 8.14 The FI Laina Aline TOTAL ASSETS LIABILITIES Federal Funds Partha Pedere Parts De NEZ DON $109,521.06 DOON S0142.54 ON Corper Corper Na, maana T1 DON $2,000.00 5.29 T2 $22,000.00 3.29 $22,000.00 5.29 $2,000.00 Te TH 5.29 $22,000.00 5.29 330,000.00 5.2 $110.33451 5.23 $LL2.078.95 Savings Depositsrat Metwi Ci nie start of Tui $100185 GON $102.333.86 GON $102 S. GON $102.159.99 GON TH Lapten Time Decoliture stato: TH 11 Ta TE T13 $22,021.30 T.5 T13 TIS THG TIe T+7 TUT THR 7.SON $20,735.00 7.50N 57.35. TT 7.50 $21.31243 T.IN $21,450X TSIN 121 BRI T.IN $22.00 7.50 $22, 2016 T. $20 as.co 7.SON SZLES TT 7.50 $21.337.43 7.SON 52145110 T.SON $21,81 TSIN $22.425.00 T.SON $22. 1439 7.50 $47.8.11 2.22% De ce Discount Window dance prasa LOUITY CAPITAL Net Worth and Retained Garnings TOTAL LIABILITIES AND NETWORTH 91 268.73 31.019,03814 S431D 51.051.000 58 Qo $120,000.00 $120,757.63 Q1 $120,000.00 $120,757.63 $1,000.00 $15,000.00 $1,000.00 $15,000.00 $1,004.94 4.23% $62.30 $15,000.00 $1,004.94 4.23% $62.30 $15,000.00 $1,006.87 4.83% $62.30 $15,000.00 $1,006.87 4.83% $62.30 $15,000.00 $1,008.77 5.03% $62.30 $15,000.00 $1,008.77 5.03% $62.30 $15,000.00 Bond Portfolio Report Book Value of Portfolio Market Value of Portfolio Maturing start of: Quarter T Market Price (1) Bank Holdings Quarter T+1 Market Price (T41) Market Yield (T+1) Coupon Amount (T+1) Bank Holdings Quarter T42 Market Price (T+2) Market Yield (T42) Coupon Amount (T+2) Bank Holdings Quarter T43 Market Price (T43) Market Yield (T+3) Coupon Amount (T+3) Bank Holdings Quarter T4 Market Price (T+4) Market Yield (T+4) Coupon Amount (T+4) Bank Holdings Quarter T45 Market Price (T45) Market Yield (T+5) Coupon Amount (T+5) Bank Holdings Quarter T+6 Market Price (T+6) Market Yield (T+6) Coupon Amount (T+6) Bank Holdings Quarter T+7 Market Price (T+7) Market Yield (T+7) Coupon Amount (T+7) Bank Holdings Quarter T+8 Market Price (T+8) Market Yield (T+8) Coupon Amount (T+8) $1,009.68 5.23% $62.30 $15,000.00 $1,009.68 5.23% $62.30 $15,000.00 $1,009.00 5.48% $62.30 $15,000.00 $1,009.00 5.48% $62.30 $15,000.00 $1,007.13 5.73% $62.30 $15,000.00 $1,007.13 5.73% $62.30 $15,000.00 $1,004.12 5.98% $62.30 $15,000.00 $1,004.12 5.98% $62.30 $15,000.00 $1,000.00 6.23% $62.30 $1,000.00 6.23% $62.30 Qo Q1 $135.60 $137.01 $136.68 $135.60 $135,604.16 $137,341.82 $136,678.20 $137,006.96 $91,269.72 $91,269.72 $94,481.40 $91,269.72 1,000,000 1,000,000 1,000,000 1,000,000 0 0 0 0 $0.00 $0.00 $0.00 $0.00 0 0 Capitalization Report Price Per Share Current quarter Prior quarter Market Value of Equity Current quarter Prior quarter Book Value of Equity Current quarter Prior quarter Number of Shares Outstanding Current quarter Prior quarter Number of Shares Sold by Management Current quarter Prior quarter Price of Shares Sold by Management Current quarter Prior quarter Number of shares Sold by Regulators Current quarter Prior quarter Price of shares Sold by Regulators Current quarter Prior quarter Dividends Paid Current quarter Prior quarter Net Total Assets Current quarter Prior quarter Risk-weighted Assets Current quarter Prior quarter Basel Tier Ratio Current quarter Prior quarter Basel Tier 1411 Ratio Current quarter Prior quarter Capital/Asset Ratio Current quarter Prior quarter 0 0 $0.00 $0.00 $0.00 $0.00 $0.00 $0.00 $0.00 $0.00 $1,019,898.14 $1,008,752.43 $1,031,066.58 $1,019,898.14 $776,417.50 $765,085.18 $786,833.11 $776,417.50 11.76% 11.93% 12.01% 11.76% 12.24% 12.37% 12.49% 12.24% 8.95% 9.05% 9.16% 8.95% Qo Q1 $188,092.02 $156.40 0.08% 0.15% $270.56 $186,385.17 $178.25 0.10% 0.15% $289.74 $123,134.93 $257.07 0.21% 0.34% $848.62 $121,945.01 $210.82 0.17% 0.38% $976.50 Loan Performance Report Fixed-Rate Corporate Loans Matured Last Quarter ($1,000s) Defaulted ($1,000s) Percent Defaulted Percent Nonperforming Nonperforming ($1,000s) Floating-Rate Corporate Loans Matured Last Quarter ($1,000s) Defaulted ($1,000) Percent Defaulted Percent Nonperforming Nonperforming ($1,000) Consumer Loans Matured Last Quarter ($1,000s) Defaulted ($1,000) Percent Defaulted Percent Nonperforming Nonperforming ($1,000s) Mortgage Loans Matured Last Quarter ($1,000s) Defaulted ($1,000s) Percent Defaulted Percent Nonperforming Nonperforming ($1,000s) TOTAL TOTAL Matured Last Quarter ($1,000s) TOTAL Defaulted ($1,000s) TOTAL Nonperforming ($1,000s) $48,167.44 $290.56 0.60% 1.10% $2,375.24 $55,250.62 $351.69 0.64% 1.06% $2,328.85 $26,894.83 $17.01 0.06% 0.11% $236.97 $28,836.52 $16.57 0.06% 0.11% $228.58 $386,289.23 $721.05 $3,731.39 $392,417.33 $757.33 $3,823.67 Qo Q1 $0.00 $0.00 $25,000.00 $0.00 $0.00 $33,000.00 $15,000.00 $0.00 $0.00 $0.00 $0.00 $0.00 $0.00 $0.00 $25,000.00 $0.00 $50,000.00 $0.00 $0.00 $50,000.00 $15,000.00 $0.00 $0.00 $0.00 $0.00 $0.00 $0.00 $0.00 Decisions Quantities Initial Reserve Allocation Federal Funds Sold Federal Funds Purchased 90-day Negotiable CDs to Issue 180-day Negotiable CDs to Issue 360-day Negotiable CDs to Issue New 8-quarter Bonds to Purchase Bonds to Sell, due start of T+2 Bonds to Sell, due start ofT+3 Bonds to Sell, due start of T+4 Bonds to Sell, due start of T45 Bonds to Sell, due start of T+6 Bonds to Sell, due start of T+7 Bonds to Sell, due start ofT+8 Rates Fixed-rate Corporate Loans Floating rate Loan Spread Consumer Loans Mortgage Loans Corporate Demand Deposits Retail Demand Deposits Savings Deposits Retail CDs Long-term Time Deposits Advertising Consumer Loans Mortgage Loans Retail Demand Deposits Corporate Demand Deposits Retail CDs Savings Deposits Long-term Time Deposits Other Miscellaneous Decisions Number of Shares to Sell Provision for Loan Losses Corporate Loan Standard, Fixed Rate Corporate Loan Standard, Floating-rate Total Dividends Percent of Cost Charged to Retail DD Percent of Cost Charged to Corporate DD 9.30% 4.00% 11.00% 9.00% 0.00% 0.00% 5.00% 6.00% 7.50% 9.30% 4.00% 11.00% 9.00% 0.00% 0.00% 5.00% 6.00% 7.50% $150.00 $80.00 $410.00 $580.00 $290.00 $140.00 $60.00 $150.00 $80.00 $410.00 $580.00 $290.00 $140.00 $60.00 0 $500.00 0 0 $1.00 0 0 $0.00 100.00% 100.00% 0 $0.00 100.00% 100.00%