Answered step by step
Verified Expert Solution
Link Copied!

Question

1 Approved Answer

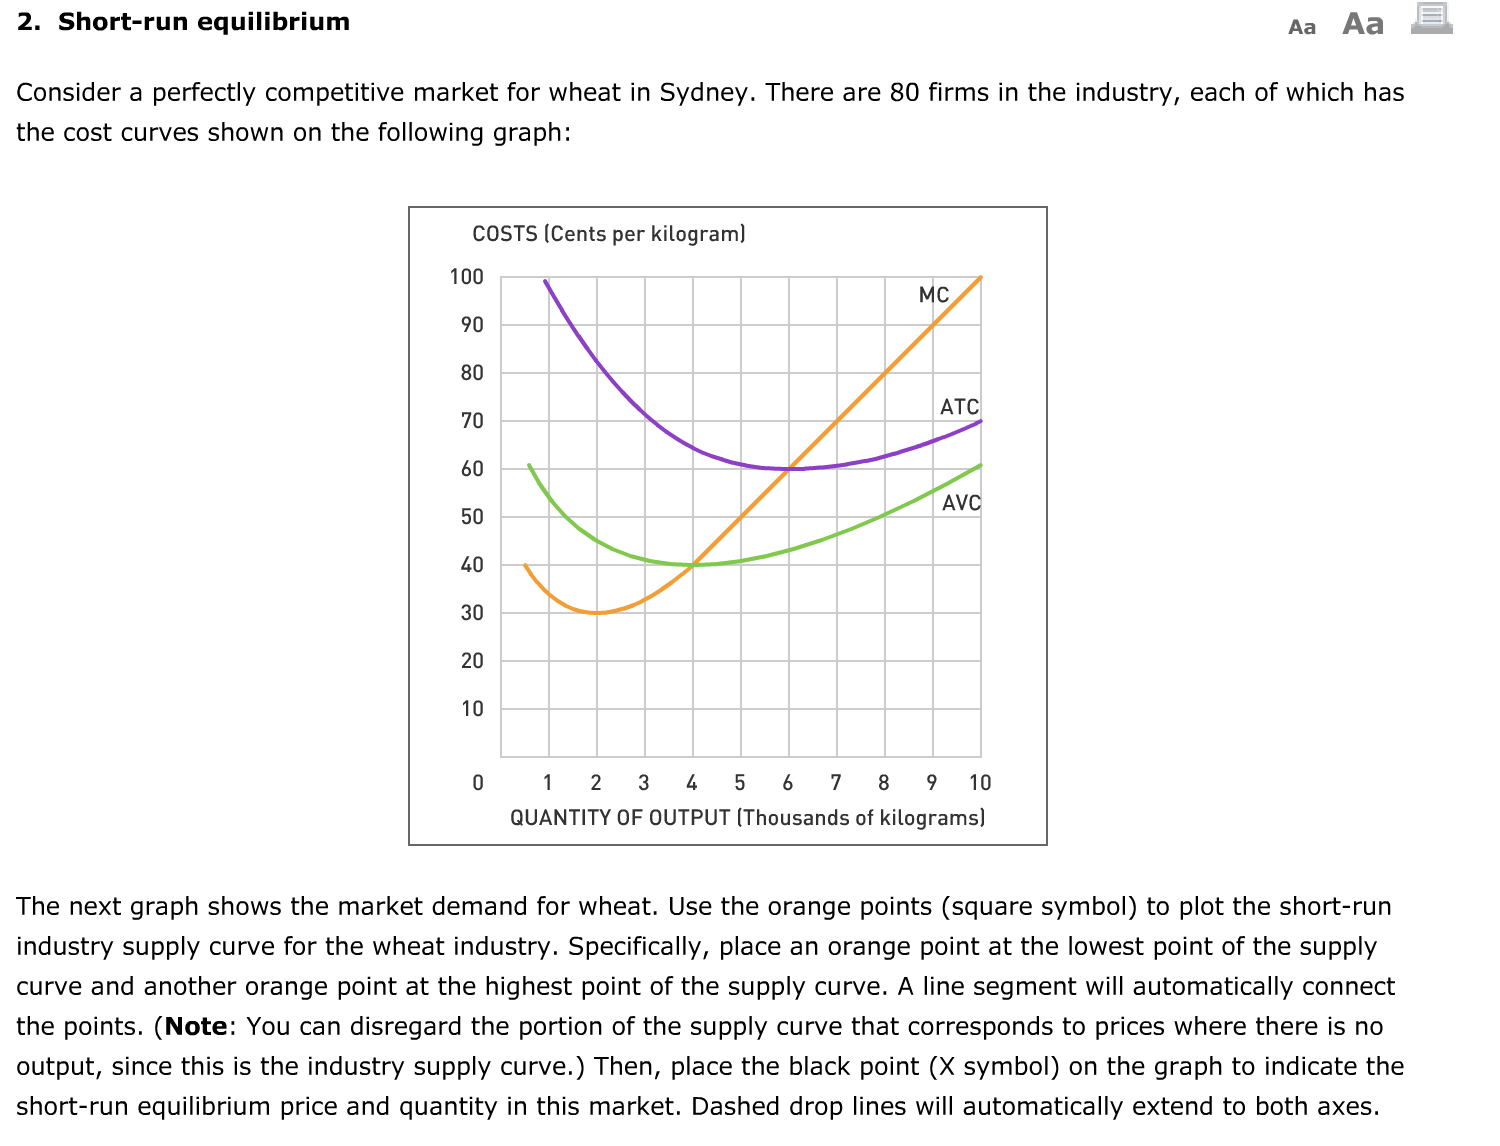
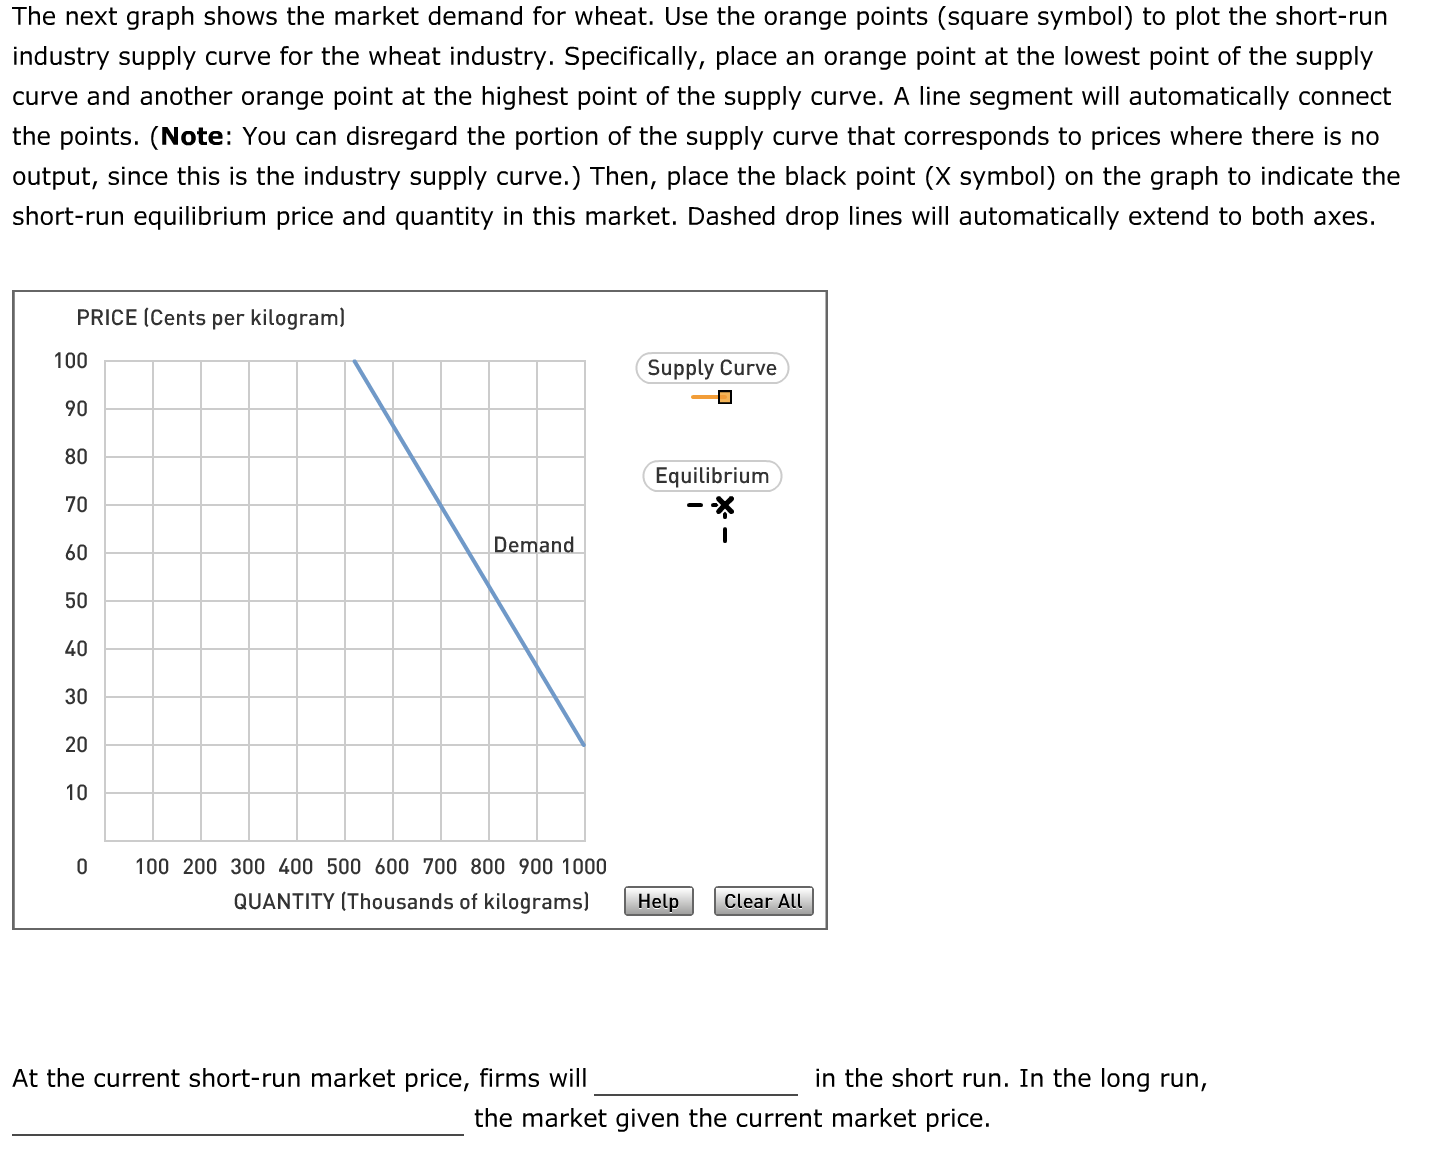
What is the answer to these question?? 2. Short-run equilibrium Aa Aa 3 Consider a perfectly competitive market for wheat in Sydney. There are 80

What is the answer to these question??

image text in transcribedimage text in transcribed
2. Short-run equilibrium Aa Aa 3 Consider a perfectly competitive market for wheat in Sydney. There are 80 rms in the industry, each of which has the cost curves shown on the following graph: COSTS [Cents per kiLog ram] 100 9|] 8|] 7|] 6|] 5|] Al] 3|] 20 1D 1 2 3 4 5 6 7 8 9 10 QUANTITY OF OUTPUT [Thousands of kilograms] The next graph shows the market demand for wheat. Use the orange points (square symbol) to plot the short-run industry supply curve for the wheat industry. Specifically, place an orange point at the lowest point of the supply curve and another orange point at the highest point of the supply curve. A line segment will automatically connect the points. (Note: You can disregard the portion of the supply curve that corresponds to prices where there is no output, since this is the industry supply curve.) Then, place the black point (X symbol) on the graph to indicate the short-run equilibrium price and quantity in this market. Dashed drop lines will automatically extend to both axes. The next graph shows the market demand for wheat. Use the orange points (square symbol) to plot the short-run industry supply curve for the wheat industry. Specifically, place an orange point at the lowest point of the supply curve and another orange point at the highest point of the supply curve. A line segment will automatically connect the points. (Note: You can disregard the portion of the supply curve that corresponds to prices where there is no output, since this is the industry supply curve.) Then, place the black point (X symbol) on the graph to indicate the short-run equilibrium price and quantity in this market. Dashed drop lines will automatically extend to both axes. PRICE [Cents per kilogram] 100 Supply Curve 90 ' 80 Equilibrium '70 _ a" I 60 50 1.0 30 20 10 100 200 300 400 500 600 700 800 9001000 QUANTITYIThousandsof kilograms] E m At the current short-run market price, rms will in the short run. In the long run, the market given the current market price

Step by Step Solution

There are 3 Steps involved in it

Step: 1

blur-text-image

Get Instant Access to Expert-Tailored Solutions

See step-by-step solutions with expert insights and AI powered tools for academic success

Step: 2

blur-text-image

Step: 3

blur-text-image

Ace Your Homework with AI

Get the answers you need in no time with our AI-driven, step-by-step assistance

Get Started

Recommended Textbook for

Exploring Economics

Authors: Robert L Sexton

5th Edition

978-1439040249, 1439040249

More Books

Students also viewed these Economics questions

Question

LO13.1 List the characteristics of monopolistic competition.

Answered: 1 week ago