Answered step by step
Verified Expert Solution
Question
1 Approved Answer
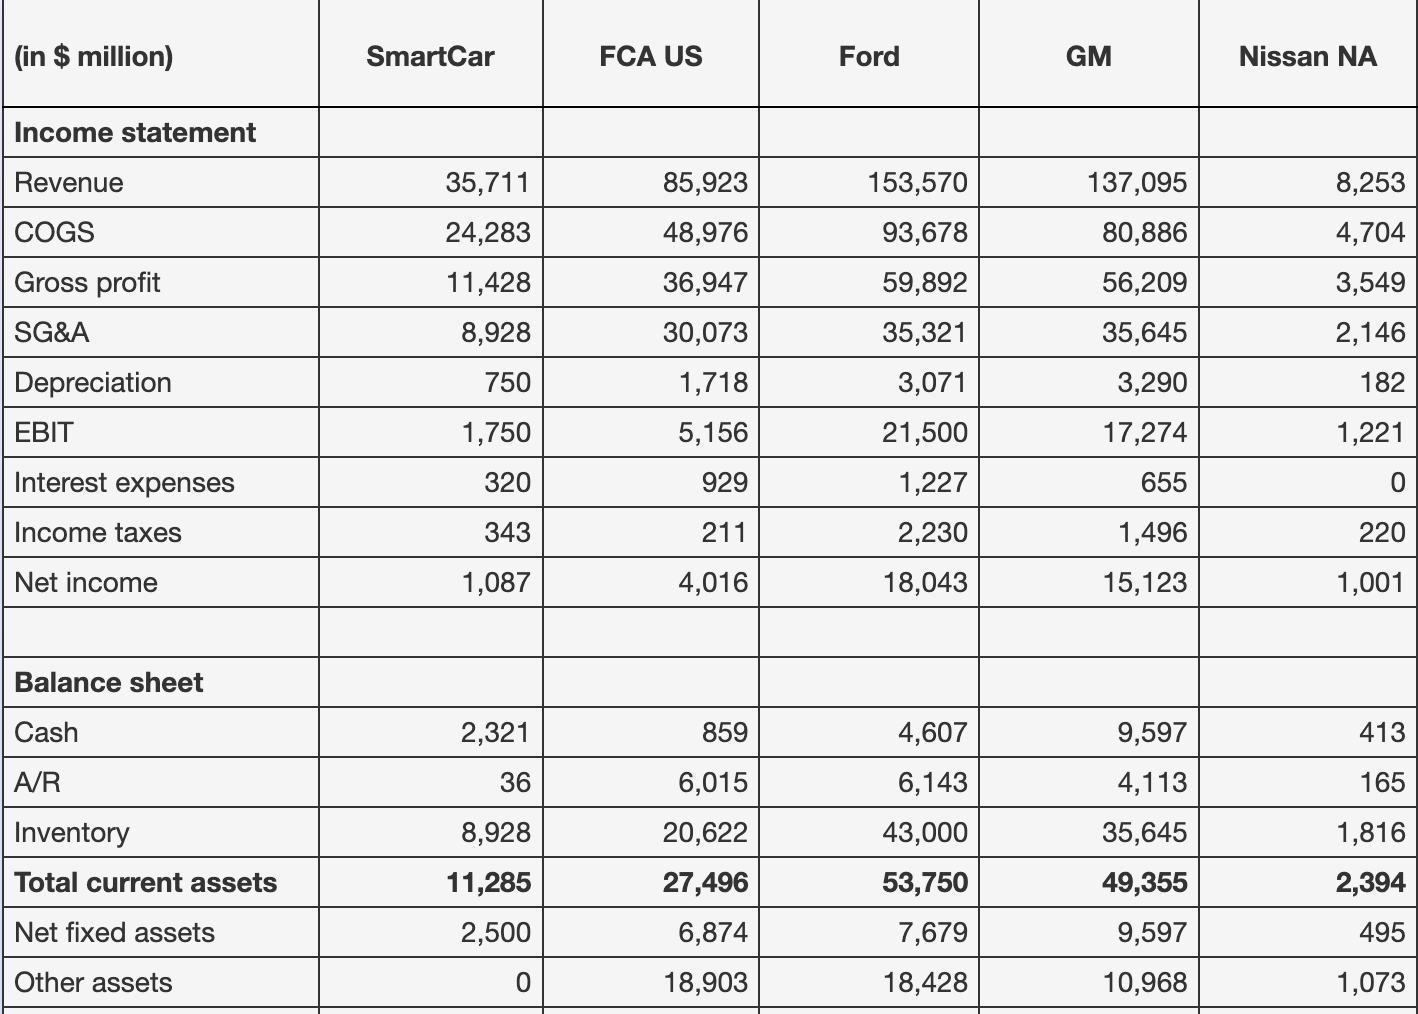
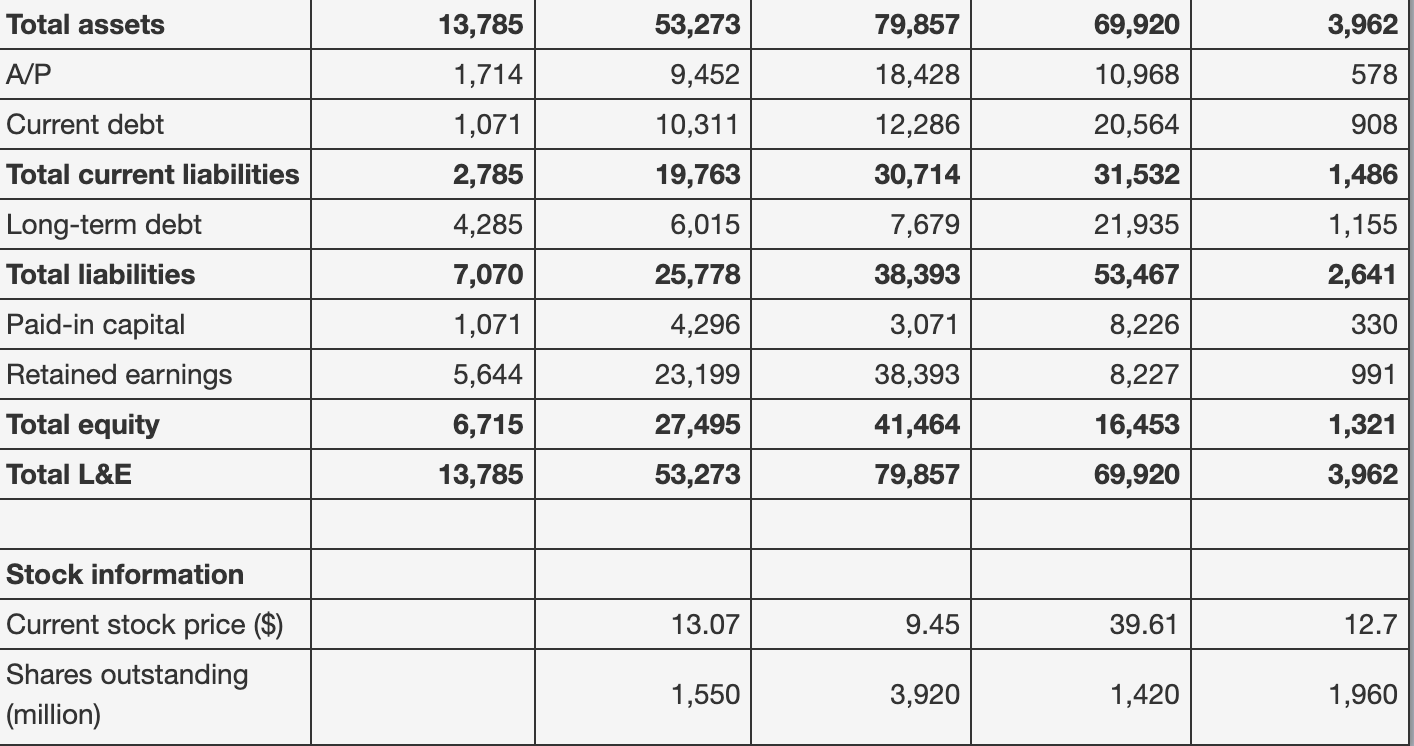
What is the average enterprise value to EBITDA ratio of the comparable companies? (in $ million) SmartCar FCA US Ford GM Nissan NA Income statement


What is the average enterprise value to EBITDA ratio of the comparable companies?
(in $ million) SmartCar FCA US Ford GM Nissan NA Income statement Revenue 35,711 24,283 85,923 48,976 153,570 93,678 COGS 137,095 80,886 56,209 35,645 8,253 4,704 3,549 2,146 Gross profit 11,428 59,892 36,947 30,073 SG&A 8,928 35,321 Depreciation 750 1,718 182 3,290 17,274 EBIT 1,750 5,156 1,221 3,071 21,500 1,227 2,230 Interest expenses 320 929 655 Income taxes 343 211 1,496 220 Net income 1,087 4,016 18,043 15,123 1,001 Balance sheet Cash 2,321 859 4,607 9,597 413 AR 36 6,015 6,143 4,113 165 Inventory 8,928 20,622 43,000 35,645 49,355 1,816 2,394 Total current assets 27,496 53,750 11,285 2,500 Net fixed assets 6,874 7,679 9,597 495 Other assets 0 18,903 18,428 10,968 1,073 Total assets 13,785 53,273 79,857 69,920 3,962 A/P 1,714 9,452 18,428 10,968 578 Current debt 1,071 10,311 12,286 20,564 908 Total current liabilities 2,785 31,532 21,935 Long-term debt 4,285 30,714 7,679 38,393 3,071 1,486 1,155 2,641 Total liabilities 53,467 19,763 6,015 25,778 4,296 23,199 27,495 53,273 8,226 Paid-in capital Retained earnings Total equity 330 7,070 1,071 5,644 6,715 13,785 8,227 991 38,393 41,464 79,857 1,321 16,453 69,920 Total L&E 3,962 Stock information 13.07 9.45 39.61 12.7 Current stock price ($) Shares outstanding (million) 1,550 3,920 1,420 1,960Step by Step Solution
There are 3 Steps involved in it
Step: 1

Get Instant Access to Expert-Tailored Solutions
See step-by-step solutions with expert insights and AI powered tools for academic success
Step: 2

Step: 3

Ace Your Homework with AI
Get the answers you need in no time with our AI-driven, step-by-step assistance
Get Started


