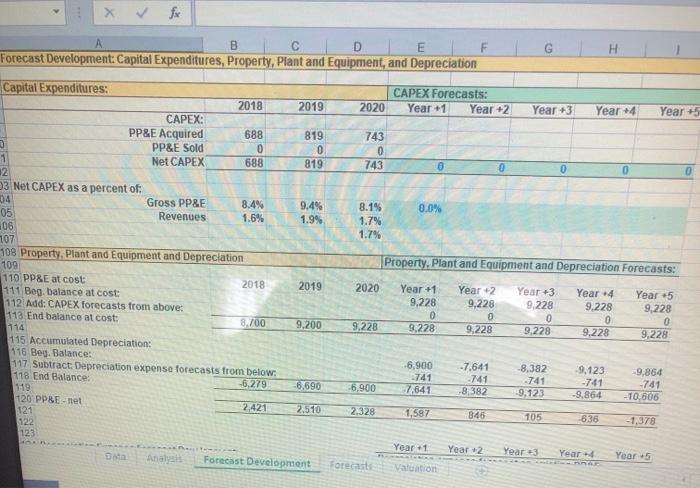
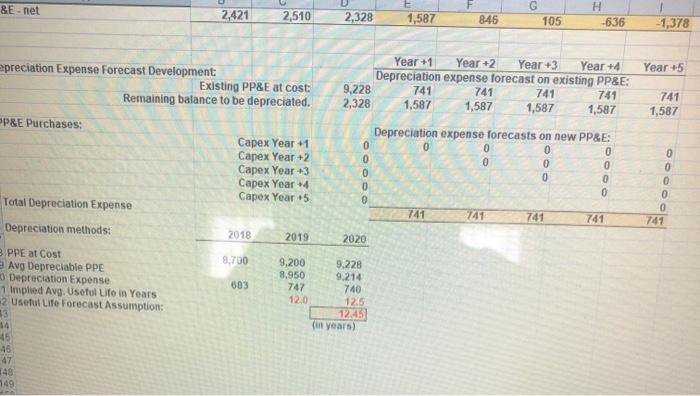
What is the capital expenditures: Capex forcast for Best Buy corporationfor the following five years.


743 A B D H Forecast Development: Capital Expenditures, Property, Plant and Equipment, and Depreciation Capital Expenditures: CAPEX Forecasts: 2018 2019 2020 Year +1 Year 2 Year +3 Year +4 Year +5 CAPEX: PP&E Acquired 688 819 743 PP&E Sold 0 0 0 1 Net CAPEX 688 819 0 0 12 23 Net CAPEX as a percent of: 04 Gross PP&E 8.4% 9.4% 8.1% 0.0% 05 Revenues 1.6% 1.9% 1.7% 06 1.7% 107 108 Property. Plant and Equipment and Depreciation Property. Plant and Equipment and Depreciation Forecasts: 109 110 PP&E at cost 2018 2019 2020 Year +1 Year 2 Year 3 Year 24 111 Beg. balance at cost: Year 5 9,228 112 Add: CAPEX forecasts from above: 9,228 9,228 9.228 9,228 0 113 End balance at cost: 0 0 0 8.700 9,200 9.228 9,228 9,228 9,228 114 9.228 9.228 115 Accumulated Depreciation: 116 Beg. Balance: 117 Subtract Depreciation expense forecasts from below. -6.900 -7.641 -8.382 -9,123 -9,864 118 End Balance: -741 -741 -741 -741 -6,279 -741 -6,690 1:19 -6.900 7,641 8.382 -9,123 -9,864 -10.606 120 PPBE-net 2,421 121 2.510 2.328 1,587 346 105 -1.378 122 123 Year 1 Year 2 Year +3 Year Year 5 Forecast Development Forecast Valuation 636 &E-net 2,421 2,510 2,328 1,587 846 G 105 H --636 -1,378 Year 5 preciation Expense Forecast Development: Existing PP&E at cost Remaining balance to be depreciated. 741 1,587 P&E Purchases: Capex Year -1 Capex Year +2 Capex Year +3 Capex Year +4 Capex Year 5 Year +1 Year +2 Year +3 Year 4 Depreciation expense forecast on existing PP&E: 9,228 741 741 741 741 2,328 1,587 1,587 1,587 1,587 Depreciation expense forecasts on new PP&E: 0 0 0 0 0 0 0 0 0 0 0 741 741 741 741 OOOO OOOOO Total Depreciation Expense 741 Depreciation methods: 2018 2019 2020 8.700 603 3 PPE at Cost Avg Depreciable PPE Depreciation Expense 1 implied Avg. Useful Life in Years 2 Useful Life Forecast Assumption: 3 14 45 46 47 148 149 9,200 9.228 8.950 9.214 747 740 12,0 125 12 (in years) 743 A B D H Forecast Development: Capital Expenditures, Property, Plant and Equipment, and Depreciation Capital Expenditures: CAPEX Forecasts: 2018 2019 2020 Year +1 Year 2 Year +3 Year +4 Year +5 CAPEX: PP&E Acquired 688 819 743 PP&E Sold 0 0 0 1 Net CAPEX 688 819 0 0 12 23 Net CAPEX as a percent of: 04 Gross PP&E 8.4% 9.4% 8.1% 0.0% 05 Revenues 1.6% 1.9% 1.7% 06 1.7% 107 108 Property. Plant and Equipment and Depreciation Property. Plant and Equipment and Depreciation Forecasts: 109 110 PP&E at cost 2018 2019 2020 Year +1 Year 2 Year 3 Year 24 111 Beg. balance at cost: Year 5 9,228 112 Add: CAPEX forecasts from above: 9,228 9,228 9.228 9,228 0 113 End balance at cost: 0 0 0 8.700 9,200 9.228 9,228 9,228 9,228 114 9.228 9.228 115 Accumulated Depreciation: 116 Beg. Balance: 117 Subtract Depreciation expense forecasts from below. -6.900 -7.641 -8.382 -9,123 -9,864 118 End Balance: -741 -741 -741 -741 -6,279 -741 -6,690 1:19 -6.900 7,641 8.382 -9,123 -9,864 -10.606 120 PPBE-net 2,421 121 2.510 2.328 1,587 346 105 -1.378 122 123 Year 1 Year 2 Year +3 Year Year 5 Forecast Development Forecast Valuation 636 &E-net 2,421 2,510 2,328 1,587 846 G 105 H --636 -1,378 Year 5 preciation Expense Forecast Development: Existing PP&E at cost Remaining balance to be depreciated. 741 1,587 P&E Purchases: Capex Year -1 Capex Year +2 Capex Year +3 Capex Year +4 Capex Year 5 Year +1 Year +2 Year +3 Year 4 Depreciation expense forecast on existing PP&E: 9,228 741 741 741 741 2,328 1,587 1,587 1,587 1,587 Depreciation expense forecasts on new PP&E: 0 0 0 0 0 0 0 0 0 0 0 741 741 741 741 OOOO OOOOO Total Depreciation Expense 741 Depreciation methods: 2018 2019 2020 8.700 603 3 PPE at Cost Avg Depreciable PPE Depreciation Expense 1 implied Avg. Useful Life in Years 2 Useful Life Forecast Assumption: 3 14 45 46 47 148 149 9,200 9.228 8.950 9.214 747 740 12,0 125 12 (in years)


