What is the code for Matlab?
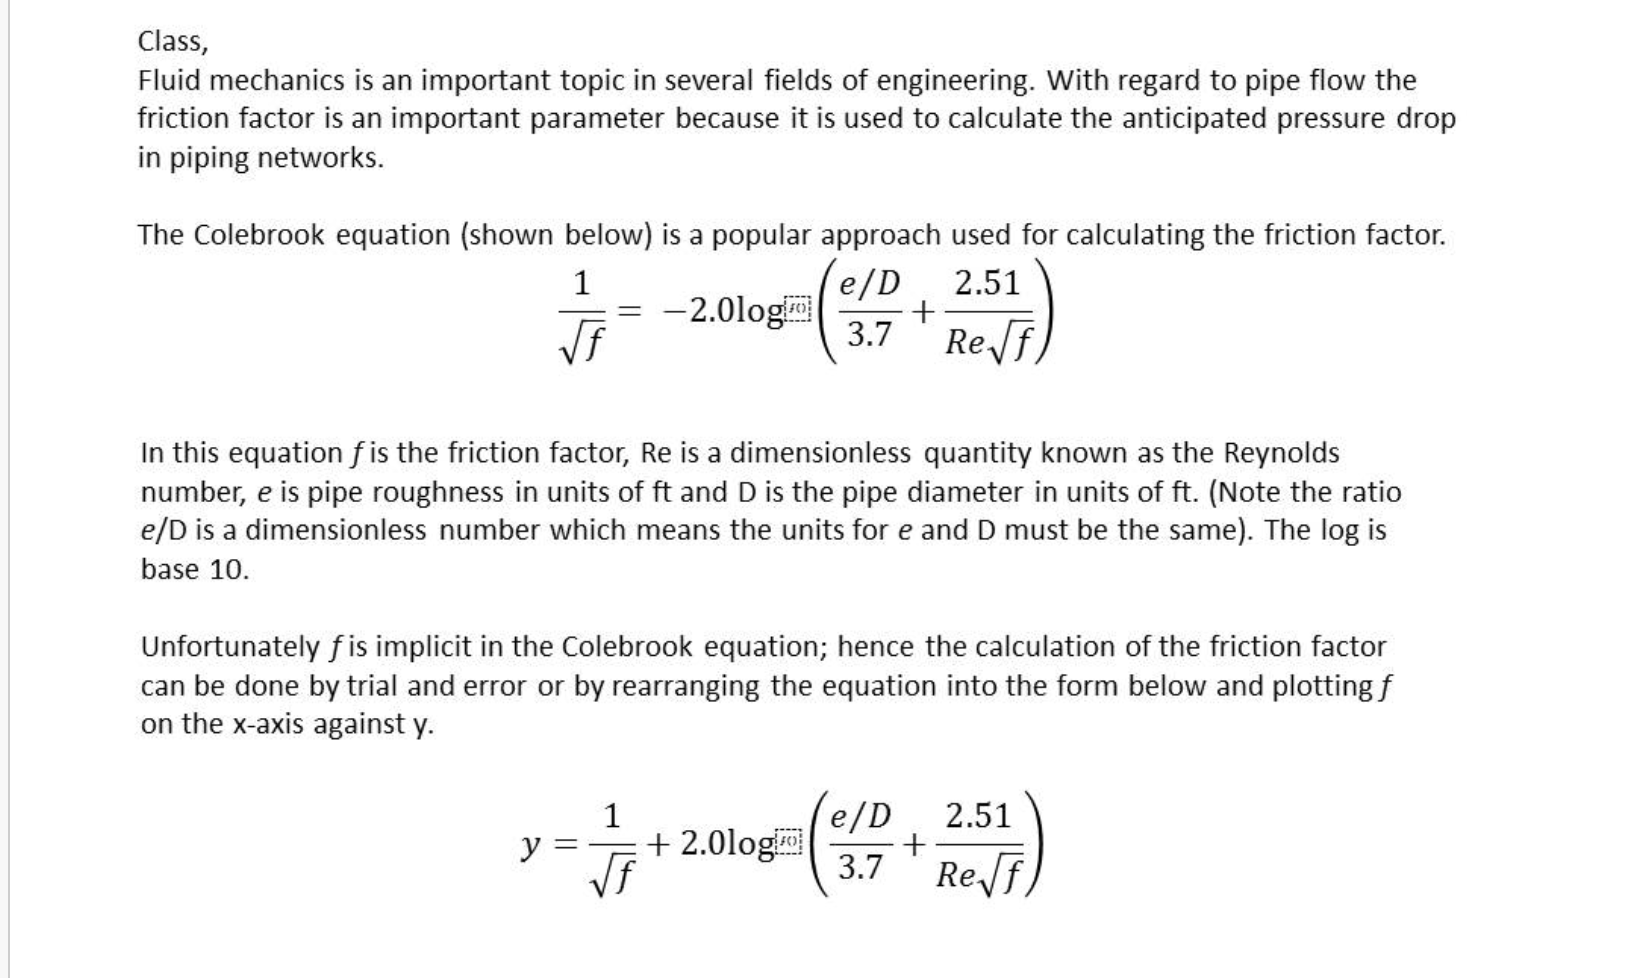
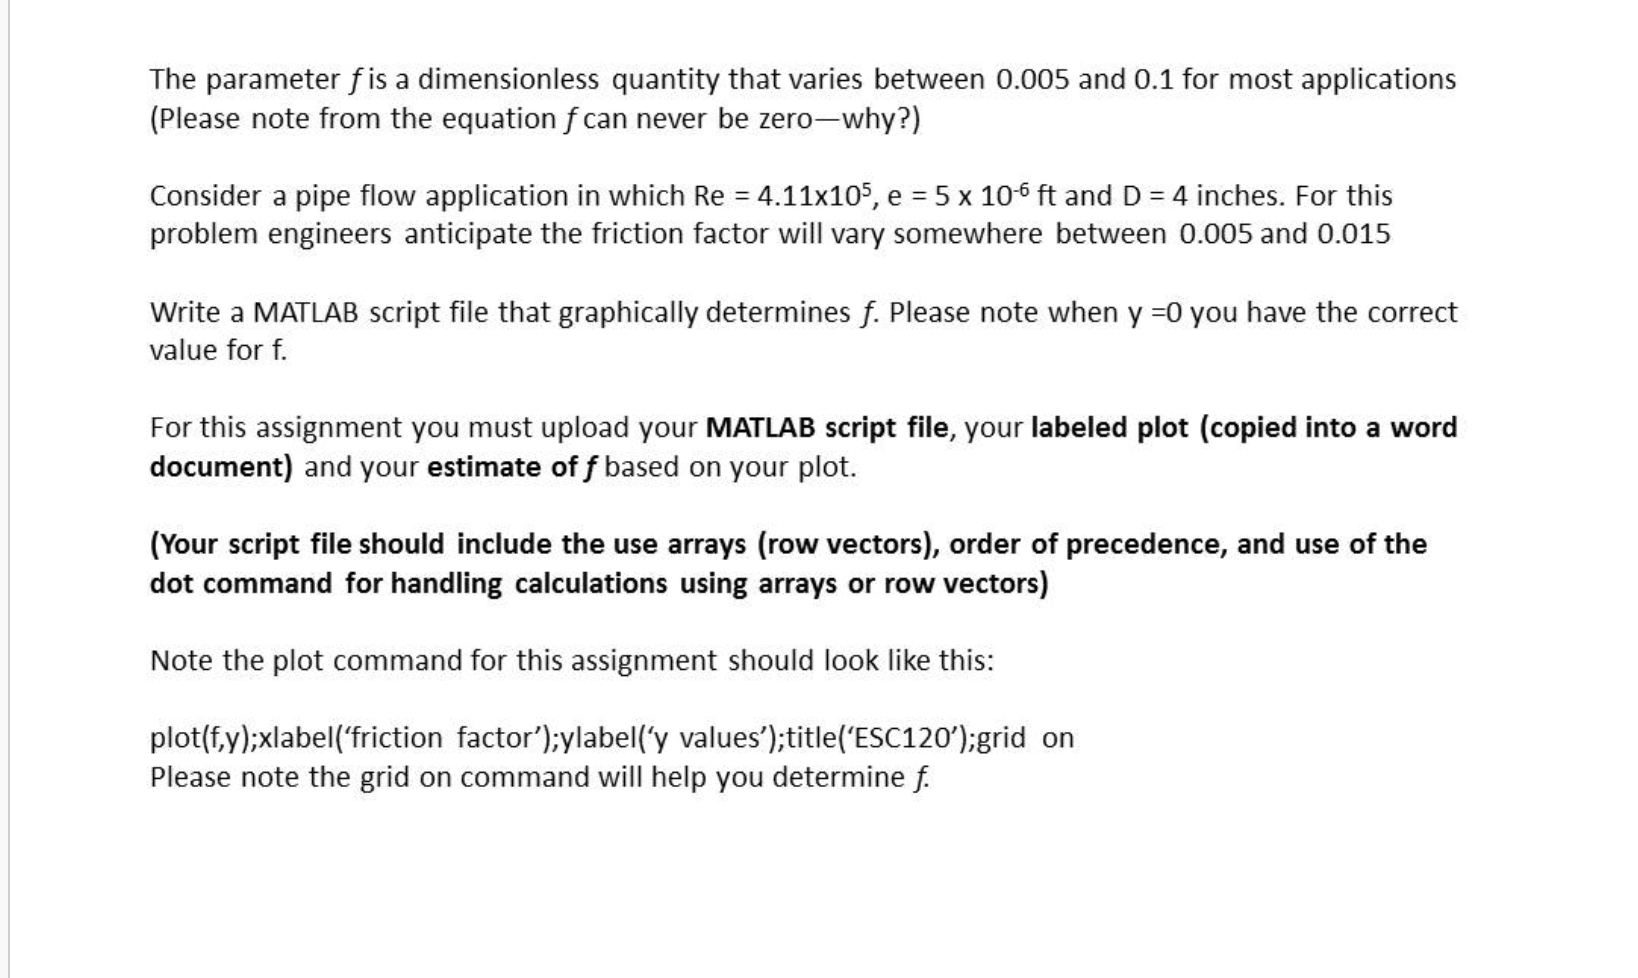
Class, Fluid mechanics is an important topic in several fields of engineering. With regard to pipe flow the friction factor is an important parameter because it is used to calculate the anticipated pressure drop in piping networks. The Colebrook equation (shown below) is a popular approach used for calculating the friction factor. 1 e/D 2.51 -2.0log! + f 3.7 Ref In this equation f is the friction factor, Re is a dimensionless quantity known as the Reynolds number, e is pipe roughness in units of ft and D is the pipe diameter in units of ft. (Note the ratio e/D is a dimensionless number which means the units for e and D must be the same). The log is base 10. Unfortunately fis implicit in the Colebrook equation; hence the calculation of the friction factor can be done by trial and error or by rearranging the equation into the form below and plotting f on the x-axis against y. 1 + 2.0logo Vf e/D 2.51 + 3.7 Ref The parameter f is a dimensionless quantity that varies between 0.005 and 0.1 for most applications (Please note from the equation f can never be zero-why?) Consider a pipe flow application in which Re = 4.11x10⁵, e = 5 x 10⁻⁶ ft and D = 4 inches. For this problem engineers anticipate the friction factor will vary somewhere between 0.005 and 0.015 Write a MATLAB script file that graphically determines f. Please note when y =0 you have the correct value for f. For this assignment you must upload your MATLAB script file, your labeled plot (copied into a word document) and your estimate off based on your plot. (Your script file should include the use arrays (row vectors), order of precedence, and use of the dot command for handling calculations using arrays or row vectors) Note the plot command for this assignment should look like this: plot(f,y);xlabel('friction factor');ylabel('y values);title('ESC120');grid on Please note the grid on command will help you determine f. Class, Fluid mechanics is an important topic in several fields of engineering. With regard to pipe flow the friction factor is an important parameter because it is used to calculate the anticipated pressure drop in piping networks. The Colebrook equation (shown below) is a popular approach used for calculating the friction factor. 1 e/D 2.51 -2.0log! + f 3.7 Ref In this equation f is the friction factor, Re is a dimensionless quantity known as the Reynolds number, e is pipe roughness in units of ft and D is the pipe diameter in units of ft. (Note the ratio e/D is a dimensionless number which means the units for e and D must be the same). The log is base 10. Unfortunately fis implicit in the Colebrook equation; hence the calculation of the friction factor can be done by trial and error or by rearranging the equation into the form below and plotting f on the x-axis against y. 1 + 2.0logo Vf e/D 2.51 + 3.7 Ref The parameter f is a dimensionless quantity that varies between 0.005 and 0.1 for most applications (Please note from the equation f can never be zero-why?) Consider a pipe flow application in which Re = 4.11x10⁵, e = 5 x 10⁻⁶ ft and D = 4 inches. For this problem engineers anticipate the friction factor will vary somewhere between 0.005 and 0.015 Write a MATLAB script file that graphically determines f. Please note when y =0 you have the correct value for f. For this assignment you must upload your MATLAB script file, your labeled plot (copied into a word document) and your estimate off based on your plot. (Your script file should include the use arrays (row vectors), order of precedence, and use of the dot command for handling calculations using arrays or row vectors) Note the plot command for this assignment should look like this: plot(f,y);xlabel('friction factor');ylabel('y values);title('ESC120');grid on Please note the grid on command will help you determine f