What is the debt-to-asset ratio of Eskimo Pie based on book value in 1990?
| | cannot be determined Based on information of comparable firms provided in Exhibit 8, and assuming that the debt ratio of Eskimo pie is 0, risk free rat is 7.42% (Exhibit 9), and market risk premium is 7.43% , what is weighted average cost of capital of Eskimo pie? | | cannot be determined Using the price multiples method, and based on the information of comparable firms provided in Exhibit 8 and estimated net income of Eskimo pie as $4million , what is the closely estimate of value of Eskimo Pie: | | cannot be determined data; 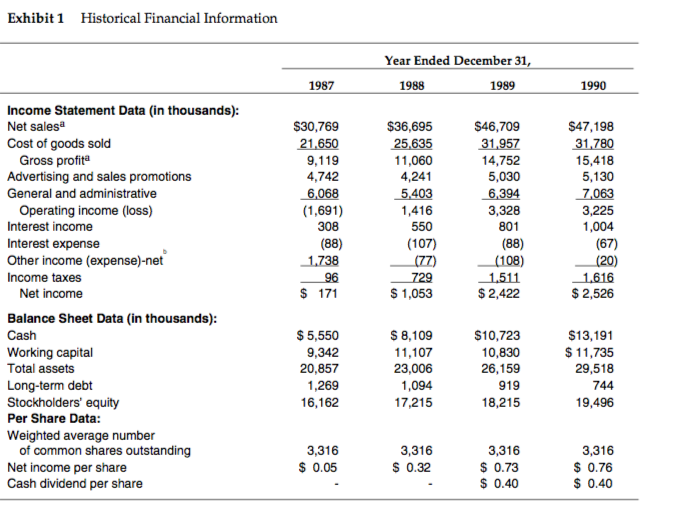
| | |
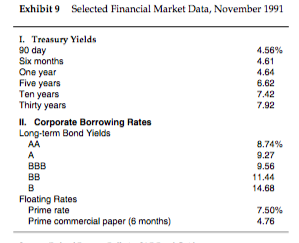
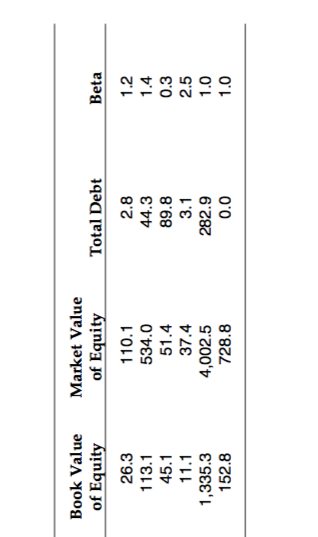
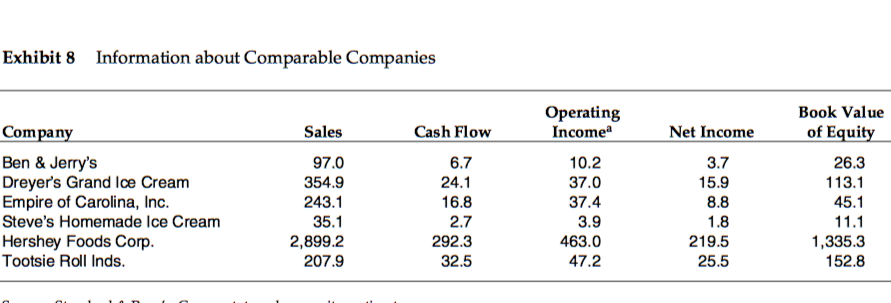
Exhibit 1 Historical Financial Information Year Ended December 31 1987 1988 1989 1990 Income Statement Data (in thousands): Net salesa Cost of goods sold $46,709 31.957 14,752 5,030 6.394 3,328 801 (88) S30,769 21,650 9,119 4,742 $36,695 25,635 11,060 4,241 5,.403 1,416 550 (107) $47,198 31 780 15,418 5,130 Gross profita Advertising and sales promotions General and administrative Operating income (loss) Interest income Interest expense Other income (expense)-net Income taxes (1,691) 308 (88) 3,225 1,004 (67) 1616 $ 2,526 Net income 1,053 $2,422 Balance Sheet Data (in thousands) Cash Working capital Total assets Long-term debt Stockholders' equity Per Share Data Weighted average number $ 5,550 9,342 20,857 1,269 16,162 $ 8,109 11,107 23.006 1,094 17,215 $10,723 10,830 26,159 919 18,215 $13,191 $11,735 29,518 744 19,496 of common shares outstanding Net income per share Cash dividend per share 3,316 0.05 3,316 0.32 3,316 $0.73 $ 0.40 3,316 0.76 0.40 Exhibit 1 Historical Financial Information Year Ended December 31 1987 1988 1989 1990 Income Statement Data (in thousands): Net salesa Cost of goods sold $46,709 31.957 14,752 5,030 6.394 3,328 801 (88) S30,769 21,650 9,119 4,742 $36,695 25,635 11,060 4,241 5,.403 1,416 550 (107) $47,198 31 780 15,418 5,130 Gross profita Advertising and sales promotions General and administrative Operating income (loss) Interest income Interest expense Other income (expense)-net Income taxes (1,691) 308 (88) 3,225 1,004 (67) 1616 $ 2,526 Net income 1,053 $2,422 Balance Sheet Data (in thousands) Cash Working capital Total assets Long-term debt Stockholders' equity Per Share Data Weighted average number $ 5,550 9,342 20,857 1,269 16,162 $ 8,109 11,107 23.006 1,094 17,215 $10,723 10,830 26,159 919 18,215 $13,191 $11,735 29,518 744 19,496 of common shares outstanding Net income per share Cash dividend per share 3,316 0.05 3,316 0.32 3,316 $0.73 $ 0.40 3,316 0.76 0.40


