

Question: What is the difference between cost variance and schedule variance? Describe the four performance indexes mentioned in chapter 11 of the text? Define control schedule
- What is the difference between cost variance and schedule variance?
- Describe the four performance indexes mentioned in chapter 11 of the text?
- Define control schedule process, list the control schedule inputs, and list the control schedule tools and techniques.
please i need good answer and please do not write by Handwriting because I find it difficult to read
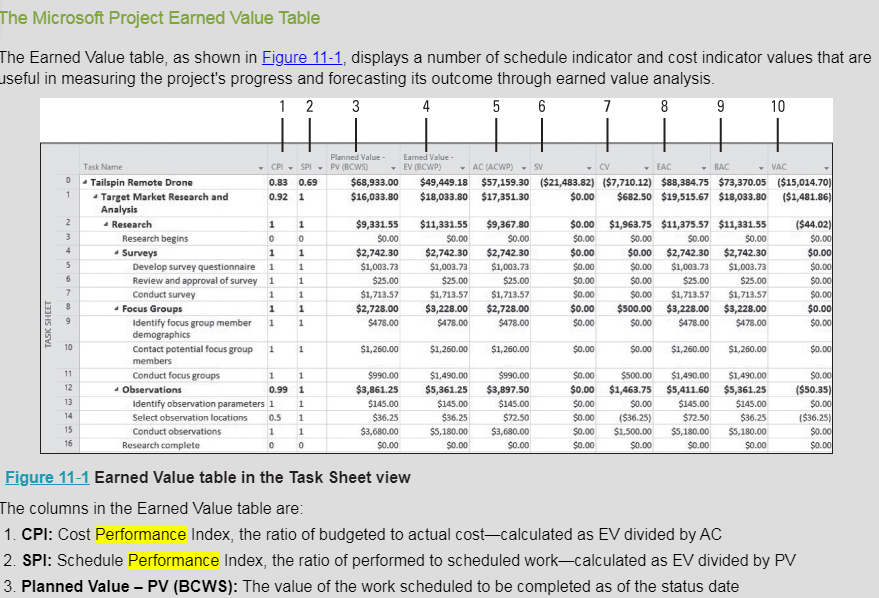
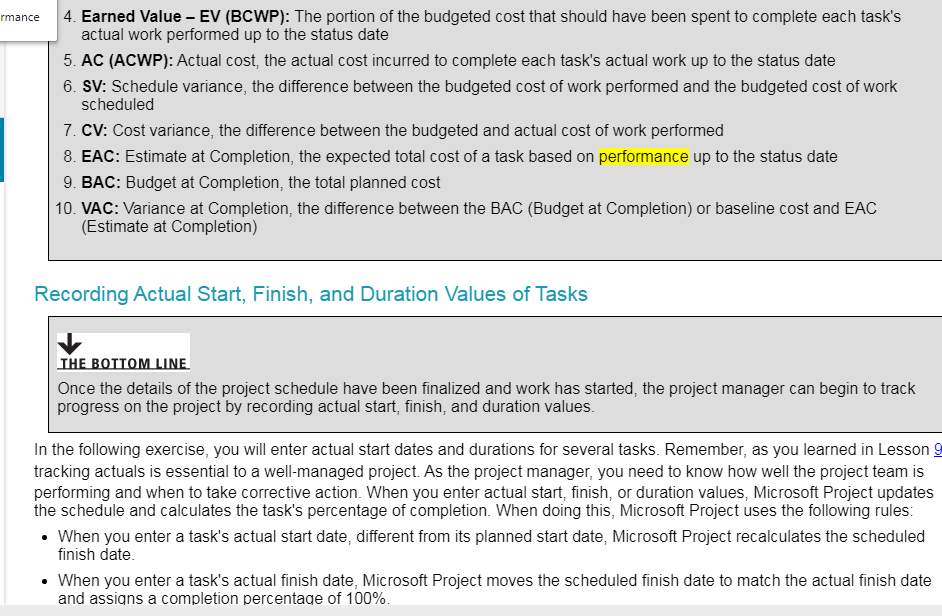
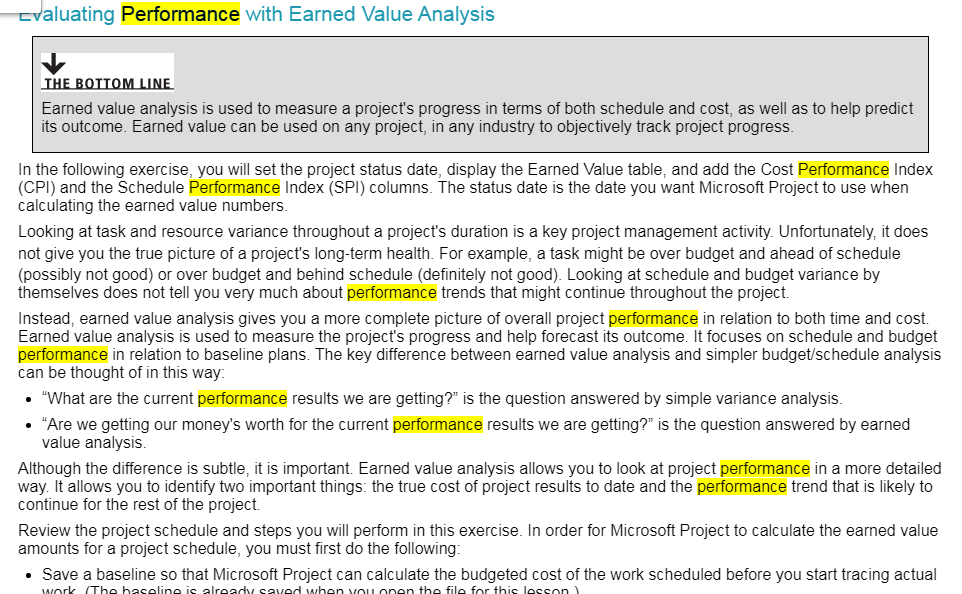
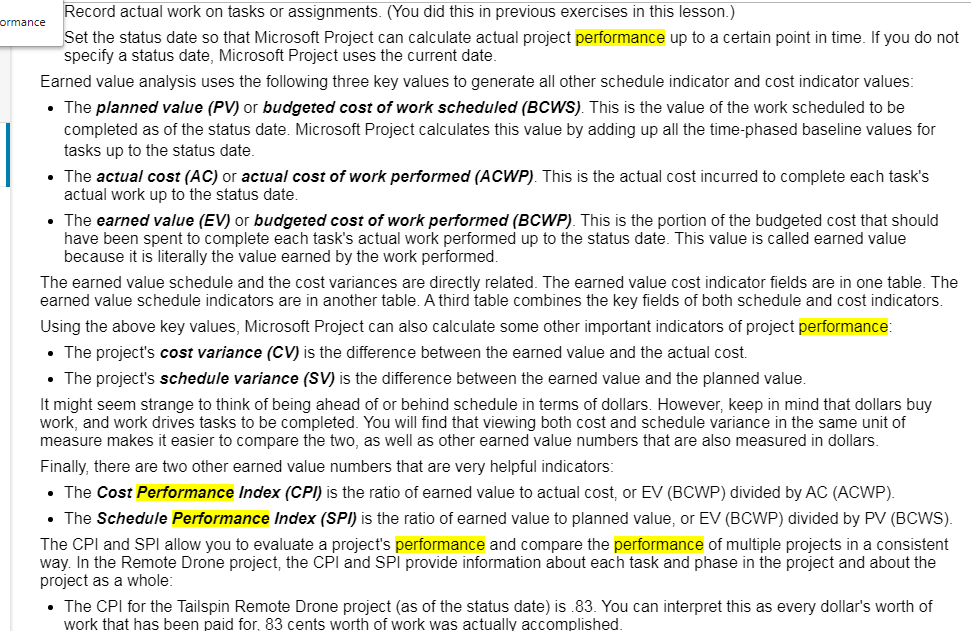
The Microsoft Project Earned Value Table The Earned Value table, as shown in Figure 11-1, displays a number of schedule indicator and cost indicator values that are useful in measuring the project's progress and forecasting its outcome through earned value analysis. 1 2 3 6 9 10 $0.00 & Planned Value - Earned Value Tuk Name - CPI - SPI - PV (BCWS) - EV (BCWP) - AC (ACWP) - SV - CV EAC BAC VAC - Tailspin Remote Drone 0.83 0.69 $68,933.00 $49,449.18 $57,159.30 ($21,483.82) ($7,710.12) $88,384.75 $73,370.05 ($15,014.70) - Target Market Research and 0.92 1 $16,033.80 $18,033.80 $17,351.30 $0.00 $682.50 $19,515.67 $18,033.80 ($1,481.86) Analysis Research 1 1 $9,331.55 $11,331.55 $9,367.80 $0.00 $1,963.75 $11,375.57 $11,331.55 ($44.02) Research begins 0 0 $0.00 $0.00 $0.00 $0.00 $0.00 $0.00 $0.00 Surveys 1 1 $2,742.30 $2,742.30 $2,742.30 $0.00 $0.00 $2,742.30 $2,742.30 $0.00 Develop survey questionnaire 1 1 $1,003,73 $1,003.73 $1,003.73 $0.00 $0.00 $1,003.73 $1,003.73 $0.00 Review and approval of survey 1 1 $25.00 $25.00 $25.00 $0.00 $0.00 $25.00 $25.00 Conduct survey $1,713.57 $1,713.57 $1,713.57 $0.00 $0.00 $1,713.57 $1,713.57 - Focus Groups $2,728.00 $3,228.00 $2,728.00 $0.00 $500.00 $3,228.00 $3,228.00 Identify focus group member 1 1 $478.00 $478.00 $478.00 $0.00 $0.00 $478.00 $478.00 demographics Contact potential focus group 1 1 $1,260.00 $1,260.00 $1,260.00 $0.00 $0.00 $1,260.00 $1,260.00 members Conduct focus groups 1 1 $990.00 $1,490.00 $990.00 $0.00 $500.00 $1,490.00 $1,490.00 $0.00 Observations 0.99 1 $3,861.25 $5,361.25 $3,897.50 $0.00 $1,463.75 $5,411.60 $5,361.25 ($50.35) Identify observation parameters 1 1 $145.00 $145.00 $145.00 $0.00 $0.00 $145.00 $145.00 $0.00 Select observation locations 0. 5 1 $36.25 $36.25 $72.50 $0.00 $36.25) $72.50 $36.25 ($36.25) Conduct observations 1 1 $3,680.00 $5,180.00 $3,680.00 $0.00 $1,500.00 $5,180.00 $5,180.00 $0.00 Research complete 0 0 $0.00 $0.00 $0.00 $0.00 $0.00 $0.00 $0.00 $0.00 9 TASK SHEET & $ Figure 11-1 Earned Value table in the Task Sheet view The columns in the Earned Value table are: 1. CPl: Cost Performance Index, the ratio of budgeted to actual cost-calculated as EV divided by AC 2. SPI: Schedule Performance Index, the ratio of performed to scheduled work-calculated as EV divided by PV 3. Planned Value - PV (BCWS): The value of the work scheduled to be completed as of the status date rmance 4. Earned Value - EV (BCWP): The portion of the budgeted cost that should have been spent to complete each task's actual work performed up to the status date 5. AC (ACWP): Actual cost, the actual cost incurred to complete each task's actual work up to the status date 6. SV: Schedule variance, the difference between the budgeted cost of work performed and the budgeted cost of work scheduled 7. CV: Cost variance, the difference between the budgeted and actual cost of work performed 8. EAC: Estimate at Completion, the expected total cost of a task based on performance up to the status date 9. BAC: Budget at Completion, the total planned cost 10. VAC: Variance at Completion, the difference between the BAC (Budget at Completion) or baseline cost and EAC (Estimate at Completion) Recording Actual Start, Finish, and Duration Values of Tasks THE BOTTOM LINE Once the details of the project schedule have been finalized and work has started, the project manager can begin to track progress on the project by recording actual start, finish, and duration values. In the following exercise, you will enter actual start dates and durations for several tasks. Remember, as you learned in Lesson 9 tracking actuals is essential to a well-managed project. As the project manager, you need to know how well the project team is performing and when to take corrective action. When you enter actual start, finish, or duration values, Microsoft Project updates the schedule and calculates the task's percentage of completion. When doing this, Microsoft Project uses the following rules: When you enter a task's actual start date, different from its planned start date, Microsoft Project recalculates the scheduled finish date. . When you enter a task's actual finish date, Microsoft Project moves the scheduled finish date to match the actual finish date and assigns a completion percentage of 100%. Evaluating Performance with Earned Value Analysis THE BOTTOM LINE Earned value analysis is used to measure a project's progress in terms of both schedule and cost, as well as to help predict its outcome. Earned value can be used on any project, in any industry to objectively track project progress. In the following exercise, you will set the project status date, display the Earned Value table, and add the Cost Performance Index (CPI) and the Schedule Performance Index (SPI) columns. The status date is the date you want Microsoft Project to use when calculating the earned value numbers. Looking at task and resource variance throughout a project's duration is a key project management activity. Unfortunately, it does not give you the true picture of a project's long-term health. For example, a task might be over budget and ahead of schedule (possibly not good) or over budget and behind schedule (definitely not good). Looking at schedule and budget variance by themselves does not tell you very much about performance trends that might continue throughout the project. Instead, earned value analysis gives you a more complete picture of overall project performance in relation to both time and cost. Earned value analysis is used to measure the project's progress and help forecast its outcome. It focuses on schedule and budget performance in relation to baseline plans. The key difference between earned value analysis and simpler budget/schedule analysis can be thought of in this way "What are the current performance results we are getting?" is the question answered by simple variance analysis. "Are we getting our money's worth for the current performance results we are getting?" is the question answered by earned value analysis. Although the difference is subtle, it is important. Earned value analysis allows you to look at project performance in a more detailed way. It allows you to identify two important things the true cost of project results to date and the performance trend that is likely to continue for the rest of the project. Review the project schedule and steps you will perform in this exercise. In order for Microsoft Project to calculate the earned value amounts for a project schedule, you must first do the following: Save a baseline so that Microsoft Project can calculate the budgeted cost of the work scheduled before you start tracing actual work (The baseline is already saved when you onan the file for this lesson Record actual work on tasks or assignments. (You did this in previous exercises in this lesson.) ormance Set the status date so that Microsoft Project can calculate actual project performance up to a certain point in time. If you do not specify a status date, Microsoft Project uses the current date. Earned value analysis uses the following three key values to generate all other schedule indicator and cost indicator values The planned value (PV) or budgeted cost of work scheduled (BCWS). This is the value of the work scheduled to be completed as of the status date. Microsoft Project calculates this value by adding up all the time-phased baseline values for tasks up to the status date. The actual cost (AC) or actual cost of work performed (ACWP). This is the actual cost incurred to complete each task's actual work up to the status date. The earned value (EV) or budgeted cost of work performed (BCWP). This is the portion of the budgeted cost that should have been spent to complete each task's actual work performed up to the status date. This value is called earned value because it is literally the value earned by the work performed. The earned value schedule and the cost variances are directly related. The earned value cost indicator fields are in one table. The earned value schedule indicators are in another table. A third table combines the key fields of both schedule and cost indicators. Using the above key values, Microsoft Project can also calculate some other important indicators of project performance The project's cost variance (CV) is the difference between the earned value and the actual cost. The project's schedule variance (SV) is the difference between the earned value and the planned value. It might seem strange to think of being ahead of or behind schedule in terms of dollars. However, keep in mind that dollars buy work, and work drives tasks to be completed. You will find that viewing both cost and schedule variance in the same unit of measure makes it easier to compare the two, as well as other earned value numbers that are also measured in dollars. Finally, there are two other earned value numbers that are very helpful indicators: The Cost Performance Index (CPI) is the ratio of earned value to actual cost, or EV (BCWP) divided by AC (ACWP). . The Schedule Performance Index (SPI) is the ratio of earned value to planned value, or EV (BCWP) divided by PV (BCWS). The CPI and SPI allow you to evaluate a project's performance and compare the performance of multiple projects in a consistent way. In the Remote Drone project, the CPI and SPI provide information about each task and phase in the project and about the project as a whole: . The CPI for the Tailspin Remote Drone project (as of the status date) is 83. You can interpret this as every dollar's worth of work that has been paid for, 83 cents worth of work was actually accomplished. The project's schedule variance (SV) is the difference between the earned value and the planned value. It might seem strange to think of being ahead of or behind schedule in terms of dollars. However, keep in mind that dollars buy work, and work drives tasks to be completed. You will find that viewing both cost and schedule variance in the same unit of measure makes it easier to compare the two, as well as other earned value numbers that are also measured in dollars. Finally, there are two other earned value numbers that are very helpful indicators: The Cost Performance Index (CPI) is the ratio of earned value to actual cost, or EV (BCWP) divided by AC (ACWP). The Schedule Performance Index (SPI) is the ratio of earned value to planned value, or EV (BCWP) divided by PV (BCWS). The CPI and SPI allow you to evaluate a project's performance and compare the performance of multiple projects in a consistent way. In the Remote Drone project, the CPI and SPI provide information about each task and phase in the project and about the project as a whole: The CPI for the Tailspin Remote Drone project (as of the status date) is.83. You can interpret this as every dollar's worth of work that has been paid for, 83 cents worth of work was actually accomplished. The SPI for the Tailspin Remote Drone project (as of the status date) is 69. This can be interpreted that for every day's worth of work that was planned to be completed, the project is only completing 69% of it in the same time period. You can also look at this as schedule efficiency, that is, you are progressing at 69% of your planned schedule. Although both the SPI and CPI are different for the Tailspin Remote Drone project, keep in mind that these ratios can change as work is completed and other factors change. Earned value analysis is one of the more complicated things you can do in Microsoft Project, but it provides very valuable project status information. This illustrates why it is a good idea to enter task and resource cost information into a project schedule any time you have it
Step by Step Solution
There are 3 Steps involved in it

Get step-by-step solutions from verified subject matter experts