what is the financial condition of the company in 2019 (compare it with the previous year and the industry)
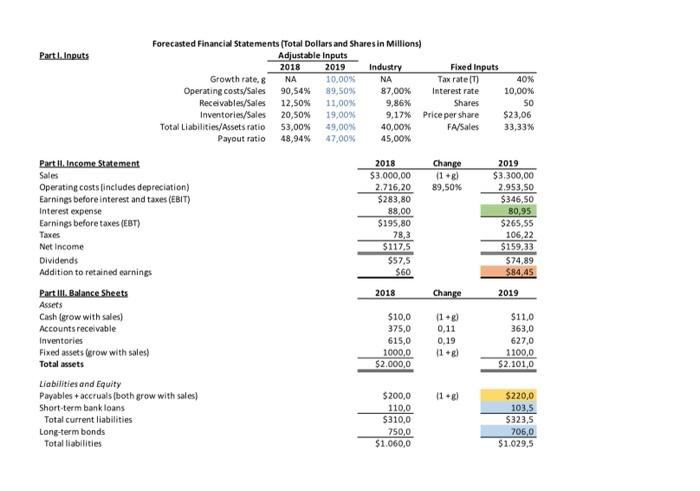
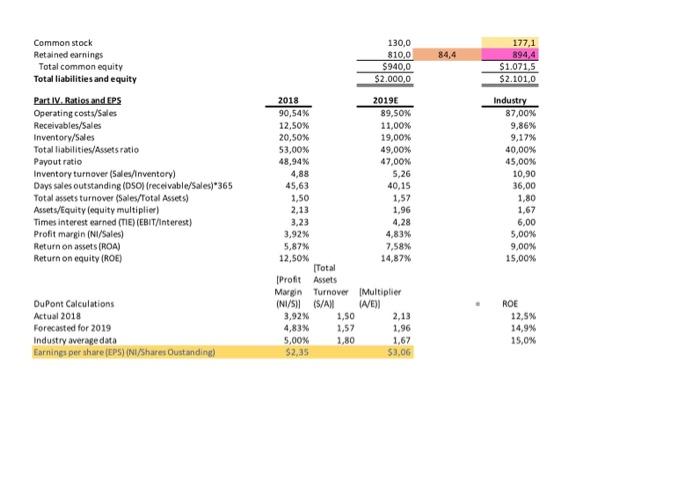
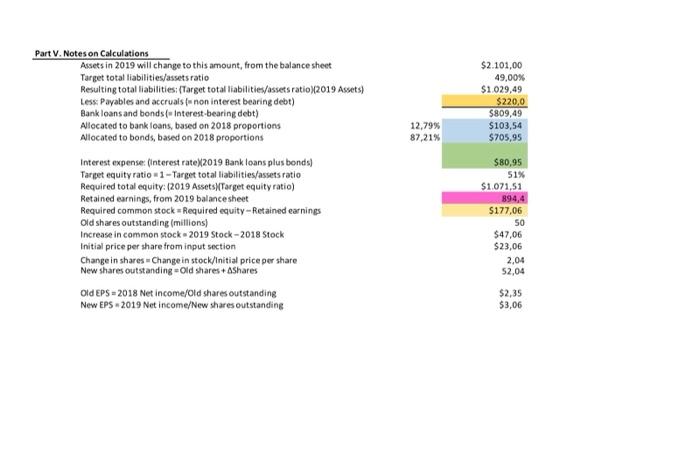
Parti. Inputs Forecasted Financial Statements (Total Dollars and Shares in Millions) Adjustable inputs 2018 2019 Industry Fixed Inputs Growth rate, NA 10.00% NA Tax rate) 40% Operating costs/Sales 90,54% 89,50% 87,00% Interest rate 10,00% Receivables/Sales 12,50% 11,00% 9,86% Shares SO Inventories/Sales 20,50 19,00% 9,17% Price per share $23,06 Total Liabilities/Assets ratio 53,00% 49,00 40,00% FA/Sales 33,33% Payout ratio 48,94% 47,00% 45,00% Change Sales 89,50% 2018 $3,000,00 2.716,20 $283,80 88,00 $195,80 78,3 $117.5 $57,5 $60 2019 $3.300,00 2.953,50 $346,50 80,95 $265.55 106,22 $159,33 $74,89 $84,45 2018 Change 2019 Part II. Income Statement Operating costs [includes depreciation) Earnings before interest and taxes (EBIT) Interest expense Earnings before taxes (ET) Taxes Net Income Dividends Addition to retained earnings Part III. Balance Sheets Assets Cash (grow with sales) Accounts receivable Inventories Fixed assets (grow with sales) Total assets Liabilities and Equity Payables + accruals (both grow with sales) Short-term bank loans Total current liabilities Long-term bonds Total liabilities $10,0 375,0 615,0 1000,0 $2.000,0 11.g) 0,11 0,19 11 g $11,0 363,0 627,0 1100,0 $2.101,0 $200,0 110,0 $310,0 750,0 $1.060,0 $220,0 103,5 $323,5 706,0 $1.029,5 84,4 130,0 810,0 $940,0 $2.000,0 177,1 894,4 $1.071,5 $2.101,0 Common stock Retained earnings Total common equity Total liabilities and equity Part IV. Ratios and EPS Operating costs/Sales Receivables/Sales Inventory/Sales Total liabilities/Assets ratio Payout ratio Inventory turnover (Sales/Inventory) Days sales outstanding (DSO) (receivable/Sales)*365 Total assets turnover (Sales/Total Assets) Assets/Equity (equity multiplier) Times interest earned (TIE) (EBIT/Interest) Profit margin (NI/Sales) Return on assets (ROA) Return on equity (ROE) 2018 2019E 90,54% 89,50% 12,50% 11,00% 20,50% 19,00% 53,00% 49,00% 48,94% 47,00% 4,88 5,26 45,63 40,15 1,50 1,57 2,13 1,96 3,23 4.28 3,92% 4,83% 5,87% 7,58% 12,50% 14,87% Total [Profit Assets Margin Turnover [Multiplier INI/S) (S/AN (A/E) 3,92% 1,50 4,83% 1,57 1,96 5,00% 1,80 1,67 $2,35 $3.06 Industry 87,00% 9,86% 9,17% 40,00% 45,00% 10,90 36,00 1,80 1,67 6,00 5,00% 9,00% 15,00% DuPont Calculations Actual 2018 Forecasted for 2019 Industry average data Earnings per share (EPS) (Ni/Shares Oustanding) ROE 12,5% 14,9% 15,0% $2.101,00 49,00% $1.029,49 $220,0 $809,49 $103,54 $705,95 12,79% 87,21% Part V. Notes on Calculations Assets in 2019 will change to this amount, from the balance sheet Target total liabilities/assets ratio Resulting total liabilities:(Target total liabilities/assets ratioX2019 Assets) Less Payables and accruals -non interest bearing debt) Bank loans and bonds (Interest-bearing debt) Allocated to bank loans, based on 2018 proportions Allocated to bonds, based on 2018 proportions Interest expense (interest rateX2019 Bank loans plus bonds) Tarpet equity ratio 1 -Target total liabilities/assets ratio Required total equity: (2019 Assets Target equity ratio) Retained earnings, from 2019 balance sheet Required common stock Required equity-Retained earnings Old shares outstanding Imillions) Increase in common stock 2019 Stock-2018 Stock Initial price per share from input section Change in shares - Change in stock/Initial price per share New shares outstanding = Old shares + Shares Old EPS = 2018 Net income/Old shares outstanding New EPS - 2019 Net income/New shares outstanding $80,95 51% $1.071,51 894,4 $177,06 50 $47,06 $23,06 2,04 52,04 $2,35 $3,06 Parti. Inputs Forecasted Financial Statements (Total Dollars and Shares in Millions) Adjustable inputs 2018 2019 Industry Fixed Inputs Growth rate, NA 10.00% NA Tax rate) 40% Operating costs/Sales 90,54% 89,50% 87,00% Interest rate 10,00% Receivables/Sales 12,50% 11,00% 9,86% Shares SO Inventories/Sales 20,50 19,00% 9,17% Price per share $23,06 Total Liabilities/Assets ratio 53,00% 49,00 40,00% FA/Sales 33,33% Payout ratio 48,94% 47,00% 45,00% Change Sales 89,50% 2018 $3,000,00 2.716,20 $283,80 88,00 $195,80 78,3 $117.5 $57,5 $60 2019 $3.300,00 2.953,50 $346,50 80,95 $265.55 106,22 $159,33 $74,89 $84,45 2018 Change 2019 Part II. Income Statement Operating costs [includes depreciation) Earnings before interest and taxes (EBIT) Interest expense Earnings before taxes (ET) Taxes Net Income Dividends Addition to retained earnings Part III. Balance Sheets Assets Cash (grow with sales) Accounts receivable Inventories Fixed assets (grow with sales) Total assets Liabilities and Equity Payables + accruals (both grow with sales) Short-term bank loans Total current liabilities Long-term bonds Total liabilities $10,0 375,0 615,0 1000,0 $2.000,0 11.g) 0,11 0,19 11 g $11,0 363,0 627,0 1100,0 $2.101,0 $200,0 110,0 $310,0 750,0 $1.060,0 $220,0 103,5 $323,5 706,0 $1.029,5 84,4 130,0 810,0 $940,0 $2.000,0 177,1 894,4 $1.071,5 $2.101,0 Common stock Retained earnings Total common equity Total liabilities and equity Part IV. Ratios and EPS Operating costs/Sales Receivables/Sales Inventory/Sales Total liabilities/Assets ratio Payout ratio Inventory turnover (Sales/Inventory) Days sales outstanding (DSO) (receivable/Sales)*365 Total assets turnover (Sales/Total Assets) Assets/Equity (equity multiplier) Times interest earned (TIE) (EBIT/Interest) Profit margin (NI/Sales) Return on assets (ROA) Return on equity (ROE) 2018 2019E 90,54% 89,50% 12,50% 11,00% 20,50% 19,00% 53,00% 49,00% 48,94% 47,00% 4,88 5,26 45,63 40,15 1,50 1,57 2,13 1,96 3,23 4.28 3,92% 4,83% 5,87% 7,58% 12,50% 14,87% Total [Profit Assets Margin Turnover [Multiplier INI/S) (S/AN (A/E) 3,92% 1,50 4,83% 1,57 1,96 5,00% 1,80 1,67 $2,35 $3.06 Industry 87,00% 9,86% 9,17% 40,00% 45,00% 10,90 36,00 1,80 1,67 6,00 5,00% 9,00% 15,00% DuPont Calculations Actual 2018 Forecasted for 2019 Industry average data Earnings per share (EPS) (Ni/Shares Oustanding) ROE 12,5% 14,9% 15,0% $2.101,00 49,00% $1.029,49 $220,0 $809,49 $103,54 $705,95 12,79% 87,21% Part V. Notes on Calculations Assets in 2019 will change to this amount, from the balance sheet Target total liabilities/assets ratio Resulting total liabilities:(Target total liabilities/assets ratioX2019 Assets) Less Payables and accruals -non interest bearing debt) Bank loans and bonds (Interest-bearing debt) Allocated to bank loans, based on 2018 proportions Allocated to bonds, based on 2018 proportions Interest expense (interest rateX2019 Bank loans plus bonds) Tarpet equity ratio 1 -Target total liabilities/assets ratio Required total equity: (2019 Assets Target equity ratio) Retained earnings, from 2019 balance sheet Required common stock Required equity-Retained earnings Old shares outstanding Imillions) Increase in common stock 2019 Stock-2018 Stock Initial price per share from input section Change in shares - Change in stock/Initial price per share New shares outstanding = Old shares + Shares Old EPS = 2018 Net income/Old shares outstanding New EPS - 2019 Net income/New shares outstanding $80,95 51% $1.071,51 894,4 $177,06 50 $47,06 $23,06 2,04 52,04 $2,35 $3,06