

Answered step by step
Verified Expert Solution
Question
1 Approved Answer
what is the Fully Diluted Shares (shared issued) for the year 2001? Exhibit 1 Nike, Inc.: Cost of Capital Consolidated Income Statements 1996 1997 1998
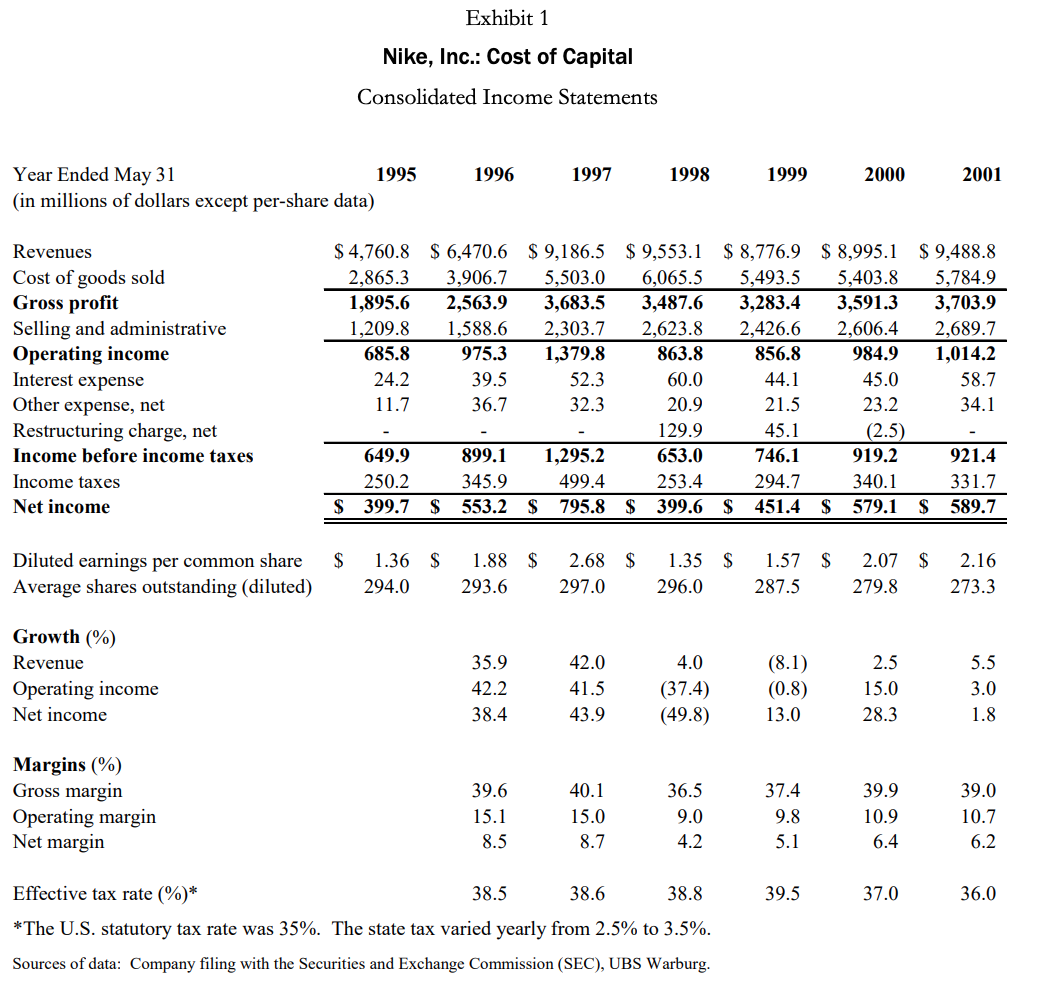
what is the Fully Diluted Shares (shared issued) for the year 2001?
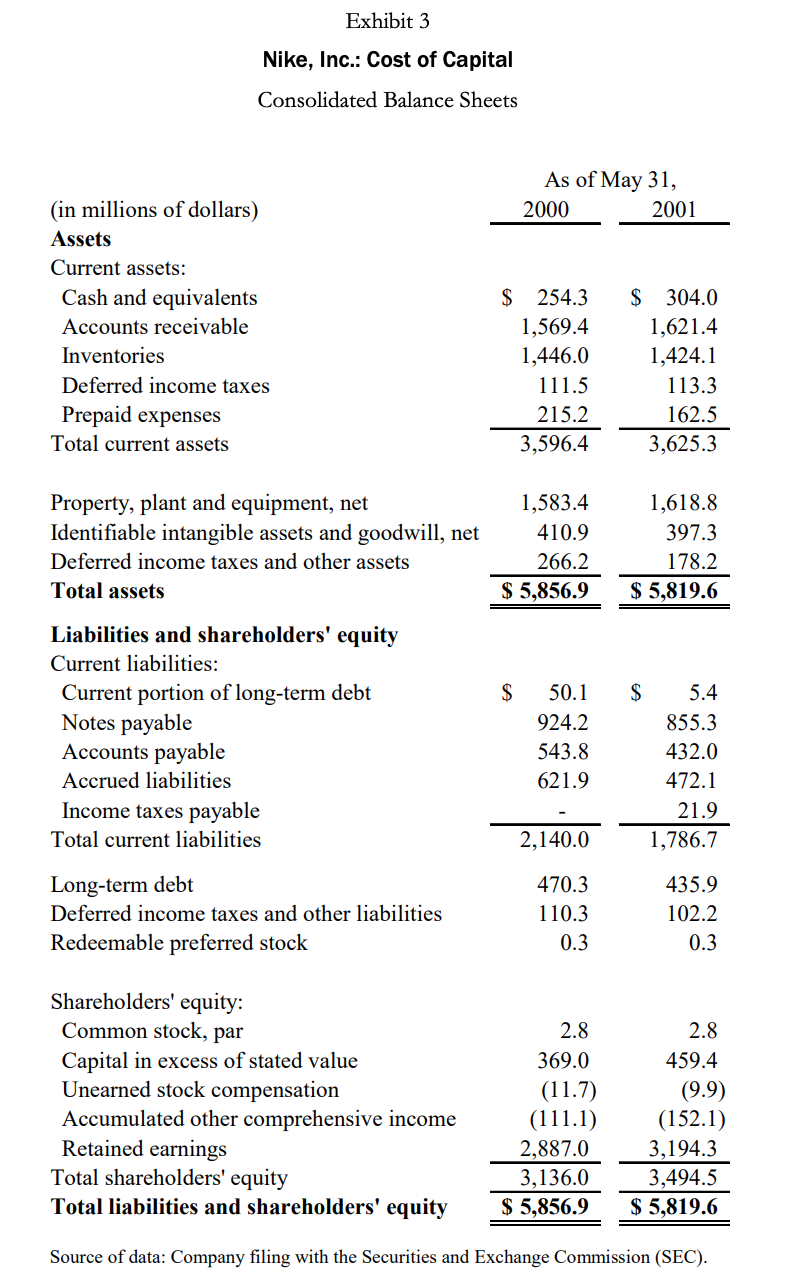
Exhibit 1 Nike, Inc.: Cost of Capital Consolidated Income Statements 1996 1997 1998 1999 2000 2001 Year Ended May 31 1995 (in millions of dollars except per-share data) Revenues Cost of goods sold Gross profit Selling and administrative Operating income Interest expense Other expense, net Restructuring charge, net Income before income taxes Income taxes Net income $ 4,760.8 $ 6,470.6 $ 9,186.5 $ 9,553.1 $ 8,776.9 $ 8,995.1 $ 9,488.8 2,865.3 3,906.7 5,503.0 6,065.5 5,493.5 5,403.8 5,784.9 1,895.6 2,563.9 3,683.5 3,487.6 3,283.4 3,591.3 3,703.9 1,209.8 1,588.6 2,303.7 2,623.8 2,426.6 2,606.4 2,689.7 685.8 975.3 1,379.8 863.8 856.8 984.9 1,014.2 24.2 39.5 52.3 60.0 44.1 45.0 58.7 11.7 36.7 32.3 20.9 21.5 23.2 34.1 129.9 45.1 (2.5) 649.9 899.1 1,295.2 653.0 746.1 919.2 921.4 250.2 345.9 499.4 253.4 294.7 340.1 331.7 $ 399.7 $ 553.2 $ 795.8 $ 399.6 $ 451.4 $ 579.1 $ 589.7 $ Diluted earnings per common share Average shares outstanding (diluted) 1.36 $ 294.0 1.88 $ 293.6 2.68 $ 297.0 1.35 $ 296.0 1.57 $ 287.5 2.07 $ 279.8 2.16 273.3 Growth (%) Revenue Operating income Net income 35.9 42.2 38.4 42.0 41.5 43.9 4.0 (37.4) (49.8) (8.1) (0.8) 13.0 2.5 15.0 28.3 5.5 3.0 1.8 Margins (%) Gross margin Operating margin Net margin 39.6 15.1 8.5 40.1 15.0 8.7 36.5 9.0 4.2 37.4 9.8 5.1 39.9 10.9 6.4 39.0 10.7 6.2 39.5 37.0 36.0 Effective tax rate (%)* 38.5 38.6 38.8 *The U.S. statutory tax rate was 35%. The state tax varied yearly from 2.5% to 3.5%. Sources of data: Company filing with the Securities and Exchange Commission (SEC), UBS Warburg. Exhibit 3 Nike, Inc.: Cost of Capital Consolidated Balance Sheets As of May 31, 2000 2001 (in millions of dollars) Assets Current assets: Cash and equivalents Accounts receivable Inventories Deferred income taxes Prepaid expenses Total current assets $ 254.3 1,569.4 1,446.0 111.5 215.2 3,596.4 $ 304.0 1,621.4 1,424.1 113.3 162.5 3,625.3 Property, plant and equipment, net Identifiable intangible assets and goodwill, net Deferred income taxes and other assets Total assets 1,583.4 410.9 266.2 $ 5,856.9 1,618.8 397.3 178.2 $ 5,819.6 $ $ 5.4 Liabilities and shareholders' equity Current liabilities: Current portion of long-term debt Notes payable Accounts payable Accrued liabilities Income taxes payable Total current liabilities 50.1 924.2 543.8 621.9 855.3 432.0 472.1 21.9 1,786.7 2,140.0 Long-term debt Deferred income taxes and other liabilities Redeemable preferred stock 470.3 110.3 0.3 435.9 102.2 0.3 Shareholders' equity: Common stock, par Capital in excess of stated value Unearned stock compensation Accumulated other comprehensive income Retained earnings Total shareholders' equity Total liabilities and shareholders' equity 2.8 369.0 (11.7) (111.1) 2,887.0 3,136.0 $ 5,856.9 2.8 459.4 (9.9) (152.1) 3,194.3 3,494.5 $ 5,819.6 Source of data: Company filing with the Securities and Exchange Commission (SEC)Step by Step Solution
There are 3 Steps involved in it
Step: 1

Get Instant Access to Expert-Tailored Solutions
See step-by-step solutions with expert insights and AI powered tools for academic success
Step: 2

Step: 3
Ace Your Homework with AI
Get the answers you need in no time with our AI-driven, step-by-step assistance
Get Started
Mergers Acquisition And Other Restructuring Activities
Authors: Donald M. Depamphilis
6th Edition
123854857, 978-0123854858