What is the Last 5 year Analysis of Financial Statements and comments on the performance of firm.
Common Size Analysis of Income statement and Balance Sheet and comments.
Horizontal Analysis Analysis of Income statement and Balance Sheet
Short-term Liquidity Analysis
Long-term Liquidity Analysis
Profitability Analysis Analysis for Investors.
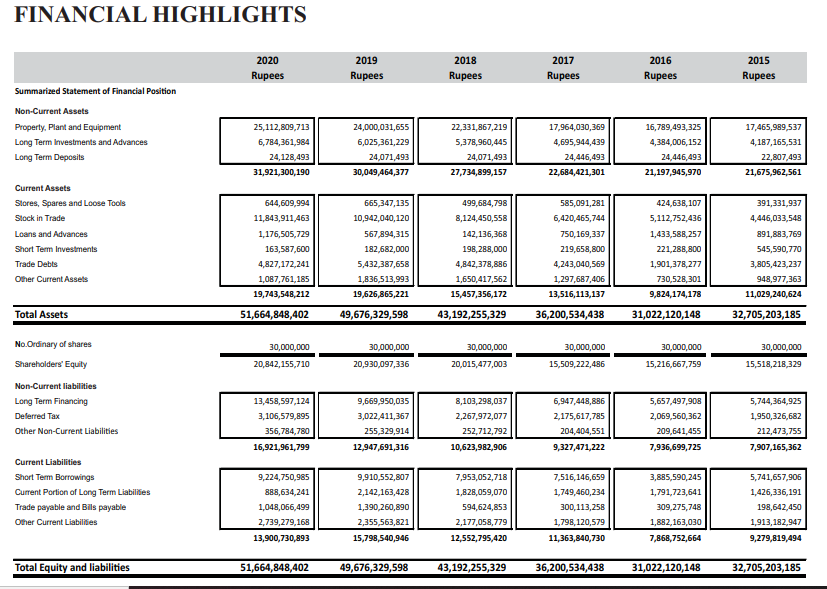
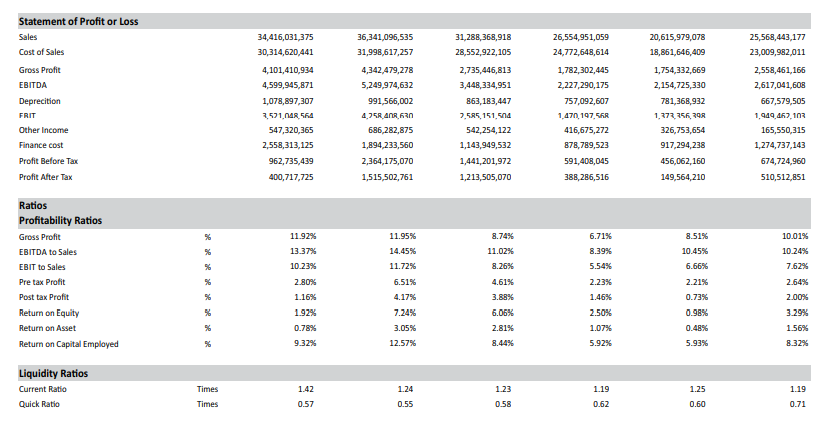
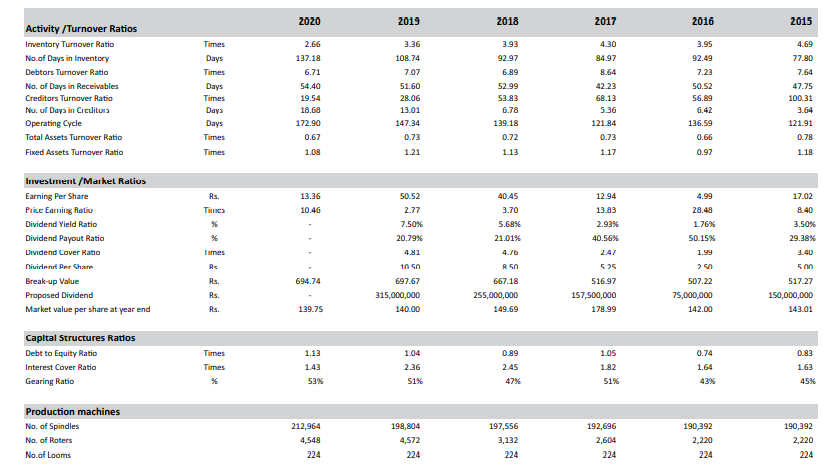
FINANCIAL HIGHLIGHTS 2020 Rupees 2019 Rupees 2018 Rupees 2017 Rupees 2016 Rupees 2015 Rupees Summarized Statement of Financial Position Non-Current Assets Property, Plant and Equipment Long Term Investments and Advances Long Term Deposits 25,112,809,713 6,784,361,984 24,128,493 31,921,300,190 24,000,031,655 6,025,361,229 24,071,493 30,049,464,377 22,331,867,219 5,378,960,445 24,071,493 27,734,899,157 17,964,030,369 4,695,944,439 24,446,493 22,684,421,301 16,789,493,325 4,384,006,152 24,446,493 21,197,945,970 17,465,989,537 4,187,165,531 22,807,493 21,675,962,561 Current Assets Stores, Spares and Loose Tools Slock in Trade Loans and Advances Short Term Investments Trade Debts Other Current Assets 644,609,994 11,843,911,463 1,176,505,729 163,587,600 4,827,172,241 1,087,761,185 19,743,548,212 665,347,135 10,942,040,120 567,894,315 182,682,000 5,432,387,658 1,836,513,993 19,626,865,221 499,684,798 8,124,450,558 142, 136,368 198,288,000 4,842,378,886 1,650,417,562 15,457,356,172 585,091,281 6,420,465,744 750,169,337 219,658,800 4,243,040,569 1,297,687,406 13,516,113,137 424,638,107 5,112,752,436 1,433,588,257 221,288,800 1,901,378,277 730,528,301 9,824,174,178 391,331,937 4,446,033,548 891,883,769 545,590,770 3,805,423,237 948,977,363 11,029,240,624 Total Assets 51,664,848,402 49,676,329,598 43,192,255,329 36,200,534,438 31,022,120,148 32,705,203,185 30,000,000 30,000,000 30,000,000 No Ordinary of shares Shareholders' Equity 30,000,000 20,842, 155,710 30,000,000 20,930,097,336 30,000,000 15,216,667,759 20,015,477,003 15,509,222,486 15,518,218,329 Non-Current liabilities Long Term Financing Deferred Tax Other Non-Current Liabilities 13,458,597,124 3,106,579,895 356,784,780 16,921,961,799 9,669,950,035 3,022,411,367 255,329,914 12,947,691,316 8,103,298,037 2,267,972,077 252,712,792 10,623,982,906 6,947,448,886 2,175,617,785 204,404,551 9,327,471,222 5,657,497,908 2,069,560,362 209,641,455 7,936,699,725 5,744,364,925 1,950,326,682 212,473,755 7,907,165,362 Current Liabilities Short Term Borrowings Current Portion of Long Term Liabilities Trade payable and Bils payable Other Current Liabilities 9,224,750,985 888,634,241 1,048,066,499 2,739,279,168 9,910,552,807 2,142,163,428 1,390,260,890 2,355,563,821 15,798,540,946 7,953,052,718 1,828,059,070 594,624,853 2,177,058,779 12,552,795,420 7,516,146,659 1,749,460,234 300, 113,258 1,798,120,579 11,363,840,730 3,885,590,245 1,791,723,641 309,275,748 1,882,163,030 7,868,752,664 5,741,657,906 1,426,336,191 198,642,450 1,913, 182,947 13,900,730,893 9,279,819,494 Total Equity and liabilities 51,664,848,402 49,676,329,598 43,192,255,329 36,200,534,438 31,022,120,148 32,705,203,185 36,341,096,535 31,998,617,257 26,554,951,059 24,772,648,614 20,615,979,078 18,861,646,409 Statement of Profit or Loss Sales Cost of Sales Gross Profit EBITDA Deprecition FRIT Other Income Finance cost Profit Before Tax Profit Alter Tax 34,416,031,375 30,314,620,441 4,101,410,934 4,599,945,871 1,078,897,307 3,571, NR 564 547,320,365 2,558,313,125 962,735,439 400,717,725 4,342,479,278 5,249,974,632 991,566,002 4.75R ANR, an 686,282,875 1,894,233,560 2,364,175,070 1,515,502,761 31,288,368,918 28,552,922,105 2,735,446,813 3,448,334,951 863,183,447 7.5R5, 151,504 542,254,122 1,143,949,532 1,441,201,972 1,213,505,070 1,782,302,445 2,227,290,175 757,092,607 1.470, 1975 416,675,272 878,789,523 591,408,045 388,286,516 1,754,332,669 2,154,725,330 781,368,932 1,872 256 290 326,753,654 917,294,238 456,062,160 149,564,210 25,568,443,177 23,009,982,011 2,558,461,166 2,617,041,608 667,579,505 1,949,462, 103 165,550,315 1,274,737,143 674,724,960 510,512,851 % 8.51% 10.45% 6.66% Ratios Profitability Ratios Gross Profit EBITDA to Sales EBIT to Sales Pre tax Profit Post tax Profit Return on Equity Return on Asset Return on Capital Employed 11.92% 13.37% 10.23% 2.80% 1.16% 1929 0.78% 9.32% 11.95% 14.45% 11.72% 6.51% 4.17% 7.24% 3.05% 12.57% 8.74% 11.02% 8.26% 4.61% 3.88% 6.05% 2.81% 8.44% 6.71% 8.39% 5.54% 2.23% 1.46% 2.50% 1.07% 5.92% 2.21% 0.73% 0.98% 0.48% 5.93% 10.01% 10.24% 7.62% 2.64% 2.00% 3.29% 1.56% 8.32% % Liquidity Ratios Times 1.42 1.24 1.23 1.19 1.25 1.19 Current Ratio Quick Ratio Times 0.57 0.55 0.58 0.62 0.60 0.71 2020 2019 2018 2017 2016 2015 4.30 3.95 4.69 77.80 92.49 Activity/Turnover Ratios Inventory Turnover Ratio No.of Days in Inventory Debtors Turnover Ratio No. of Days in Receivables Creditors Turnover Ratio Nu. of Days in Cicuitus Operating Cycle Total Assets Turnover Ratio Fixed Assets Turnover Ratio Times Days Times Days Times Days Days Times Times 2.66 137.18 6.71 54.40 19.54 18.68 172.90 3.36 108.74 7.07 51.60 28.06 13.01 147.34 0.73 1.21 3.93 92.97 6.89 52.99 53.83 6.78 139.18 0.72 1.13 84.97 8.64 42.23 68.13 5.36 121.84 0.73 7.23 50.52 56.89 6.42 136.59 0.66 0.97 7.64 47.75 100.31 3.64 121.91 0.67 0.78 1.08 1.17 1.18 13.36 10.46 4.99 28.48 Investment Market Ralius Earning Per Share Price Eaming Ratio Dividend Yield Ratio Dividend Payout Ratio Dividend Cover Ratio Nividend Per Charr Break-up Value Proposed Dividend Market value per share at year end Rs. Times % % Times RS 17.02 8.40 3.50% 29.38% 50.52 2.77 7.50% 20.79% 4.81 10 697.67 315,000,000 140.00 40.45 3.70 5.68% 21.01% 4.76 8 667.18 255,000,000 149.69 12.94 13.83 2.93% 40.56% 2.41 525 516.97 157,500,000 178.99 1.76% 50.15% 1.99 3.40 Rs. 694.74 Rs. Rs. 507.22 75,000,000 142.00 517.27 150,000,000 143.01 139.75 1.13 1.04 0.74 0.83 Capital Structures Ratlos Debt to Equity Ratio Interest Cover Ratio Gearing Ratio Times Times % 0.89 2.45 1.05 1.82 1.43 1.64 1.63 2.36 51% 53% 47% 51% 43% 45% Production machines No. of Spindles No. of Roters No.of Looms 212,964 4,548 224 198,804 4,572 224 197,556 3,132 224 192,696 2,604 224 190,392 2.220 224 190,392 2,220 224 FINANCIAL HIGHLIGHTS 2020 Rupees 2019 Rupees 2018 Rupees 2017 Rupees 2016 Rupees 2015 Rupees Summarized Statement of Financial Position Non-Current Assets Property, Plant and Equipment Long Term Investments and Advances Long Term Deposits 25,112,809,713 6,784,361,984 24,128,493 31,921,300,190 24,000,031,655 6,025,361,229 24,071,493 30,049,464,377 22,331,867,219 5,378,960,445 24,071,493 27,734,899,157 17,964,030,369 4,695,944,439 24,446,493 22,684,421,301 16,789,493,325 4,384,006,152 24,446,493 21,197,945,970 17,465,989,537 4,187,165,531 22,807,493 21,675,962,561 Current Assets Stores, Spares and Loose Tools Slock in Trade Loans and Advances Short Term Investments Trade Debts Other Current Assets 644,609,994 11,843,911,463 1,176,505,729 163,587,600 4,827,172,241 1,087,761,185 19,743,548,212 665,347,135 10,942,040,120 567,894,315 182,682,000 5,432,387,658 1,836,513,993 19,626,865,221 499,684,798 8,124,450,558 142, 136,368 198,288,000 4,842,378,886 1,650,417,562 15,457,356,172 585,091,281 6,420,465,744 750,169,337 219,658,800 4,243,040,569 1,297,687,406 13,516,113,137 424,638,107 5,112,752,436 1,433,588,257 221,288,800 1,901,378,277 730,528,301 9,824,174,178 391,331,937 4,446,033,548 891,883,769 545,590,770 3,805,423,237 948,977,363 11,029,240,624 Total Assets 51,664,848,402 49,676,329,598 43,192,255,329 36,200,534,438 31,022,120,148 32,705,203,185 30,000,000 30,000,000 30,000,000 No Ordinary of shares Shareholders' Equity 30,000,000 20,842, 155,710 30,000,000 20,930,097,336 30,000,000 15,216,667,759 20,015,477,003 15,509,222,486 15,518,218,329 Non-Current liabilities Long Term Financing Deferred Tax Other Non-Current Liabilities 13,458,597,124 3,106,579,895 356,784,780 16,921,961,799 9,669,950,035 3,022,411,367 255,329,914 12,947,691,316 8,103,298,037 2,267,972,077 252,712,792 10,623,982,906 6,947,448,886 2,175,617,785 204,404,551 9,327,471,222 5,657,497,908 2,069,560,362 209,641,455 7,936,699,725 5,744,364,925 1,950,326,682 212,473,755 7,907,165,362 Current Liabilities Short Term Borrowings Current Portion of Long Term Liabilities Trade payable and Bils payable Other Current Liabilities 9,224,750,985 888,634,241 1,048,066,499 2,739,279,168 9,910,552,807 2,142,163,428 1,390,260,890 2,355,563,821 15,798,540,946 7,953,052,718 1,828,059,070 594,624,853 2,177,058,779 12,552,795,420 7,516,146,659 1,749,460,234 300, 113,258 1,798,120,579 11,363,840,730 3,885,590,245 1,791,723,641 309,275,748 1,882,163,030 7,868,752,664 5,741,657,906 1,426,336,191 198,642,450 1,913, 182,947 13,900,730,893 9,279,819,494 Total Equity and liabilities 51,664,848,402 49,676,329,598 43,192,255,329 36,200,534,438 31,022,120,148 32,705,203,185 36,341,096,535 31,998,617,257 26,554,951,059 24,772,648,614 20,615,979,078 18,861,646,409 Statement of Profit or Loss Sales Cost of Sales Gross Profit EBITDA Deprecition FRIT Other Income Finance cost Profit Before Tax Profit Alter Tax 34,416,031,375 30,314,620,441 4,101,410,934 4,599,945,871 1,078,897,307 3,571, NR 564 547,320,365 2,558,313,125 962,735,439 400,717,725 4,342,479,278 5,249,974,632 991,566,002 4.75R ANR, an 686,282,875 1,894,233,560 2,364,175,070 1,515,502,761 31,288,368,918 28,552,922,105 2,735,446,813 3,448,334,951 863,183,447 7.5R5, 151,504 542,254,122 1,143,949,532 1,441,201,972 1,213,505,070 1,782,302,445 2,227,290,175 757,092,607 1.470, 1975 416,675,272 878,789,523 591,408,045 388,286,516 1,754,332,669 2,154,725,330 781,368,932 1,872 256 290 326,753,654 917,294,238 456,062,160 149,564,210 25,568,443,177 23,009,982,011 2,558,461,166 2,617,041,608 667,579,505 1,949,462, 103 165,550,315 1,274,737,143 674,724,960 510,512,851 % 8.51% 10.45% 6.66% Ratios Profitability Ratios Gross Profit EBITDA to Sales EBIT to Sales Pre tax Profit Post tax Profit Return on Equity Return on Asset Return on Capital Employed 11.92% 13.37% 10.23% 2.80% 1.16% 1929 0.78% 9.32% 11.95% 14.45% 11.72% 6.51% 4.17% 7.24% 3.05% 12.57% 8.74% 11.02% 8.26% 4.61% 3.88% 6.05% 2.81% 8.44% 6.71% 8.39% 5.54% 2.23% 1.46% 2.50% 1.07% 5.92% 2.21% 0.73% 0.98% 0.48% 5.93% 10.01% 10.24% 7.62% 2.64% 2.00% 3.29% 1.56% 8.32% % Liquidity Ratios Times 1.42 1.24 1.23 1.19 1.25 1.19 Current Ratio Quick Ratio Times 0.57 0.55 0.58 0.62 0.60 0.71 2020 2019 2018 2017 2016 2015 4.30 3.95 4.69 77.80 92.49 Activity/Turnover Ratios Inventory Turnover Ratio No.of Days in Inventory Debtors Turnover Ratio No. of Days in Receivables Creditors Turnover Ratio Nu. of Days in Cicuitus Operating Cycle Total Assets Turnover Ratio Fixed Assets Turnover Ratio Times Days Times Days Times Days Days Times Times 2.66 137.18 6.71 54.40 19.54 18.68 172.90 3.36 108.74 7.07 51.60 28.06 13.01 147.34 0.73 1.21 3.93 92.97 6.89 52.99 53.83 6.78 139.18 0.72 1.13 84.97 8.64 42.23 68.13 5.36 121.84 0.73 7.23 50.52 56.89 6.42 136.59 0.66 0.97 7.64 47.75 100.31 3.64 121.91 0.67 0.78 1.08 1.17 1.18 13.36 10.46 4.99 28.48 Investment Market Ralius Earning Per Share Price Eaming Ratio Dividend Yield Ratio Dividend Payout Ratio Dividend Cover Ratio Nividend Per Charr Break-up Value Proposed Dividend Market value per share at year end Rs. Times % % Times RS 17.02 8.40 3.50% 29.38% 50.52 2.77 7.50% 20.79% 4.81 10 697.67 315,000,000 140.00 40.45 3.70 5.68% 21.01% 4.76 8 667.18 255,000,000 149.69 12.94 13.83 2.93% 40.56% 2.41 525 516.97 157,500,000 178.99 1.76% 50.15% 1.99 3.40 Rs. 694.74 Rs. Rs. 507.22 75,000,000 142.00 517.27 150,000,000 143.01 139.75 1.13 1.04 0.74 0.83 Capital Structures Ratlos Debt to Equity Ratio Interest Cover Ratio Gearing Ratio Times Times % 0.89 2.45 1.05 1.82 1.43 1.64 1.63 2.36 51% 53% 47% 51% 43% 45% Production machines No. of Spindles No. of Roters No.of Looms 212,964 4,548 224 198,804 4,572 224 197,556 3,132 224 192,696 2,604 224 190,392 2.220 224 190,392 2,220 224