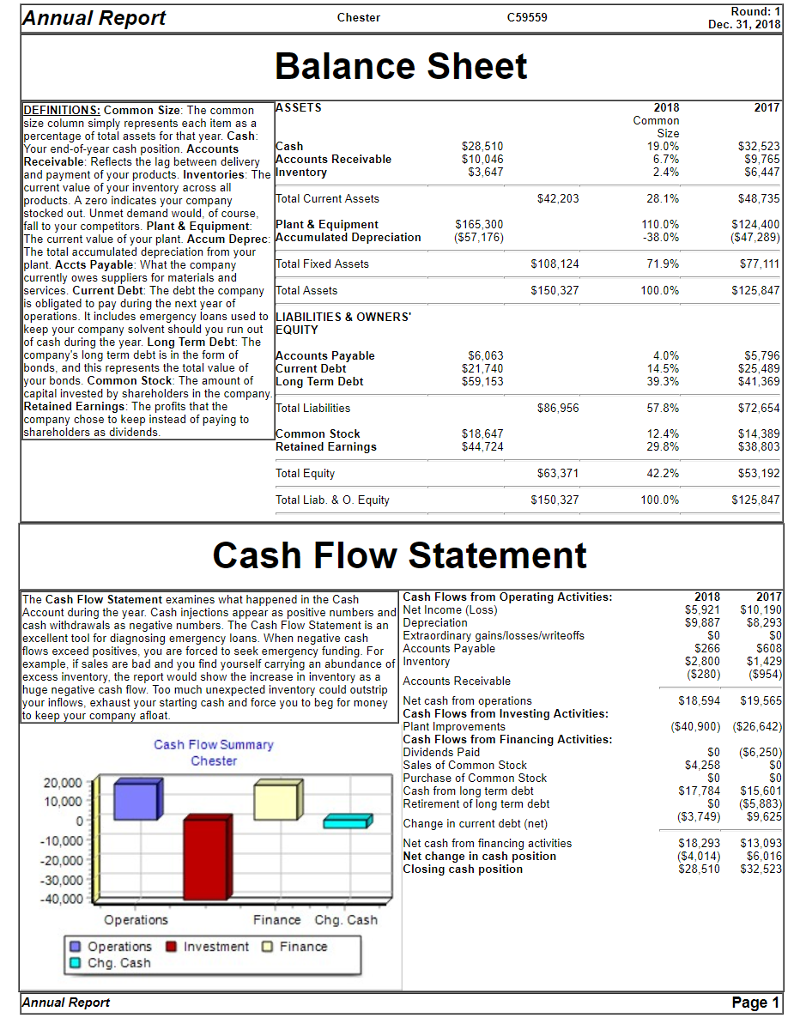
| What is the Liability to Equity ratio of Chester? | | Select: 1 | | | | | | | | | | | | | | | | 

| 1.94 | | |
| |
| |
nnual Report 59559 Chester Dec. 31, 2018 Balance Sheet DEFINITIONS: Common Size: The common SSETS 2017 Common size column simply represents each item as a percentage of total assets for that year. Cash Your end-of-year cash position. Accounts Receivable: Reflects the lag between delivery Accounts Receivable and payment of your products. Inventories: The nventory current value of your inventory across al products. A zero indicates your company stocked out. Unmet demand would, of course fall to your competitors. Plant & Equipment: The current value of your plant. Accum Deprec: Accumulated Depreciation(57,176) The total accumulated depreciation from your plant. Accts Payable: What the company currently owes suppliers for materials and services. Current Debt: The debt the company Total Assets is obligated to pay during the next year of operations. It includes emergency loans used to LIABILITIES&OWNERS keep your company solvent should you run out EQUITY 528,510 $3,647 $32,523 S9,765 $6,447 otal Current Assets $42,203 $48,735 otal Fixed Assets $108,124 $150,327 cash during the year. Long erm Debt: ne company's long term debt is in the form of bonds, and this represents the total value of your bonds. Common Stock: The amount of Long Term Debt capital invested by shareholders in the company Retained Earnings: The profits that the company chose to keep instead of paying to shareholders as didends ccounts Payable urrent Debt $6,063 $25,489 $59,153 otal Liabilities $86,956 18,647 544,724 ommon Stock Retained Earnings Total Equity Total Liab. & O. Equity $38,803 $53,192 S125,847 $63,371 $150,327 100.0% Cash Flow Statement 2017 S5,921 $10,190 $9,887 $8,293 The Cash Flow Statement examines what happened in the Cash Cash Flows from Operating Activities: ccount during the year. Cash injections appear as positive numbers and Net Income (Loss) cash withdrawals as negative numbers. The Cash Flow Statement is an Depreciation excellent tool for diagnosing emergency loans. When negative cash Extraordinary gainslosses/writeoffs s exceed positives, you are forced to seek emergency funding. For [Accounts Payable example, if sales are bad and you find yourself carrying an abundance of Inventory excess inventory, the report would show the increase in inventory as a Accounts Receivable huge negative cash flow. Too much unexpected inventory could outstrip your inflows, exhaust your starting cash and force you to beg for money Net cash from operations 5608 S2,800 $1,429 (S280) ($954) $18,594 $19,565 Cash Flows from Investing Activities: Plant Improvements Cash Flows from Financing Activities: Dividends Paid Sales of Common Stock Purchase of Common Stock Cash from long term debt Retirement of long term debt r company afloat (540,900) (526,642) Cash Flow Summary 50 $17,784 $15,601 ($5,883) S0 20,000 10,000 (53,749 9.625 $18,293 $13,093 $28,510 $32,523 Change in current debt (net) 10,000 20,000 -30,000 -40,000 Net cash from financing activities Net change in cash position Closing cash position Operations Finance Chg. Cash Operations Investment Finance nnual Report


