Suppose the following table showed the distribution of tax savings due to a tax reform in a sample of 1000 households (i.e. this is

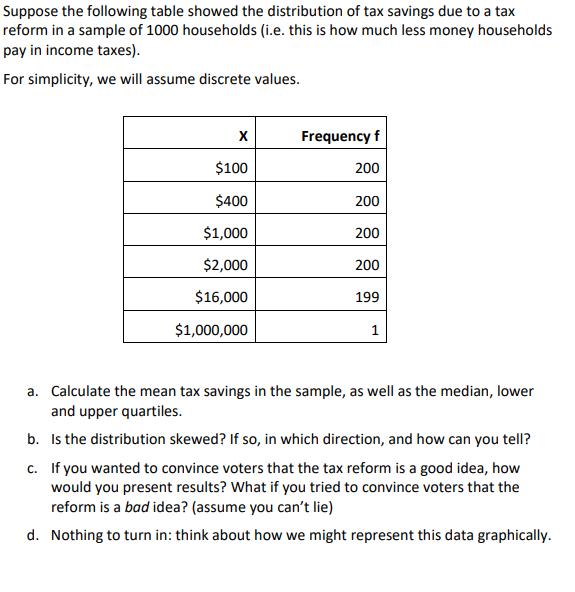
Suppose the following table showed the distribution of tax savings due to a tax reform in a sample of 1000 households (i.e. this is how much less money households pay in income taxes). For simplicity, we will assume discrete values. X $100 $400 $1,000 $2,000 $16,000 $1,000,000 Frequency f 200 200 200 200 199 1 a. Calculate the mean tax savings in the sample, as well as the median, lower and upper quartiles. b. Is the distribution skewed? If so, in which direction, and how can you tell? c. If you wanted to convince voters that the tax reform is a good idea, how would you present results? What if you tried to convince voters that the reform is a bad idea? (assume you can't lie) d. Nothing to turn in: think about how we might represent this data graphically.
Step by Step Solution
3.50 Rating (173 Votes )
There are 3 Steps involved in it
Step: 1

See step-by-step solutions with expert insights and AI powered tools for academic success
Step: 2

Step: 3

Ace Your Homework with AI
Get the answers you need in no time with our AI-driven, step-by-step assistance
Get Started


