

Question
What is the present value of the projected merger benefits in Table A as of December 31, 2015? Are the projections reasonable? How does the


What is the present value of the projected merger benefits in Table A as of December 31, 2015? Are the projections reasonable? How does the present value of the pre-merger operational improvements compare to the post-merger combination synergies? (To derive the railroad WACC, assume a market risk premium of 5.5%, a debt beta of .15%, and a corporate tax rate of 36%).
Using the data in case Exhibit 9b, analyze the changes in market values of CP and NS in response to the rumors of a pending offer (11/6/2015 11/9/2015) and the initial CP offer (11/17/2015 11/18/2015). Is the markets reaction consistent with your valuation of the projected merger benefits from Question 2?
What is the value of CPs revised offer on December 8 (before CP sweetened its offer by adding the CVR security)? In your analysis, assume the following:
A valuation date of December 31, 2015 and year-end cashflows;
The standalone (pre-merger) values of CP and NS are $134 and $80 per share, respectively;
NS shareholders approve the merger and the Surface Transportation Board (STB) approves it;
Investors expect 100% of projected merger benefits to be realized. What is the value if investors expect none of the projected merger benefits to be realized?
NS must debt finance 100% of the cash portion of the revised offer ($32.86 per share)
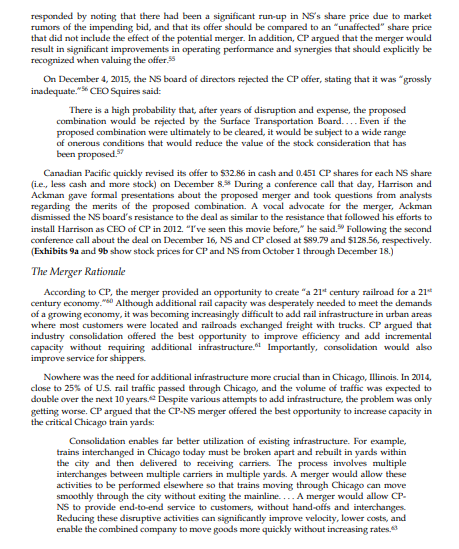
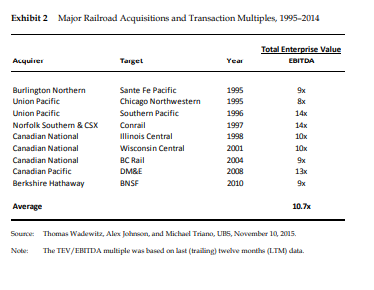
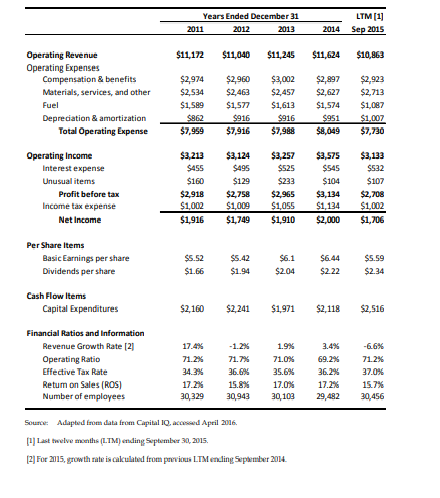
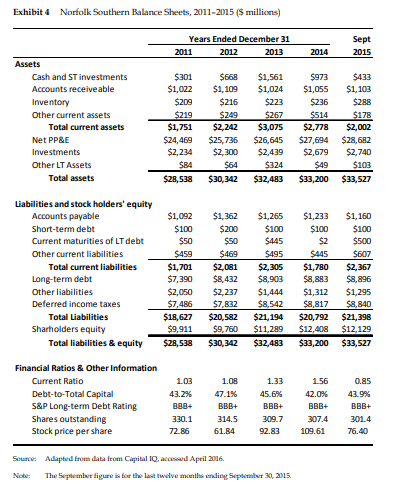
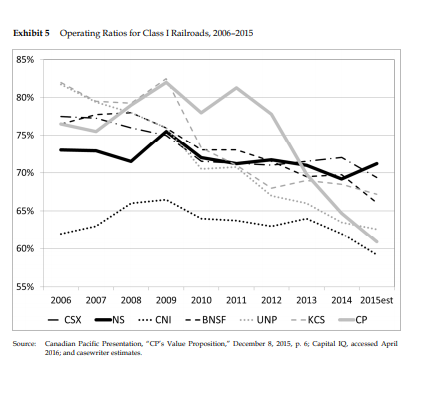
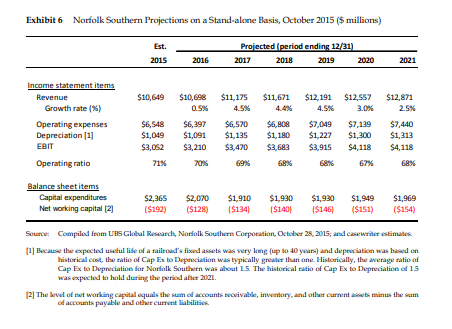
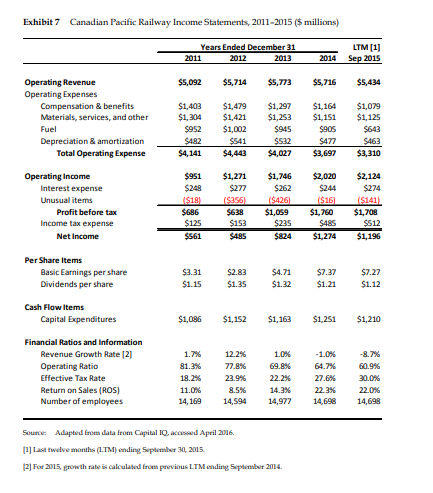
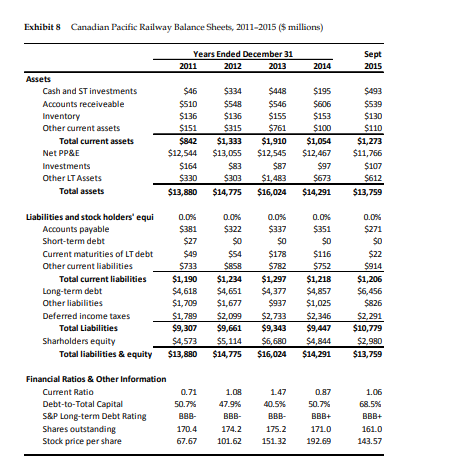
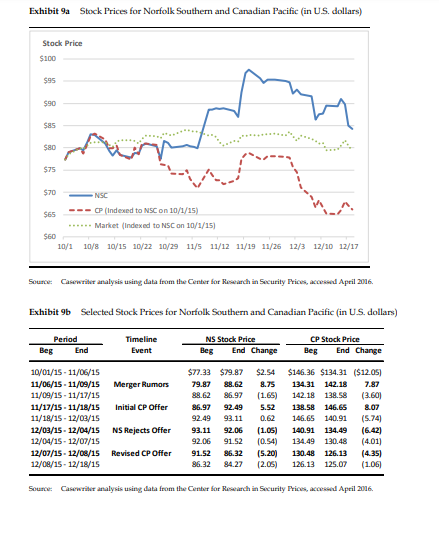
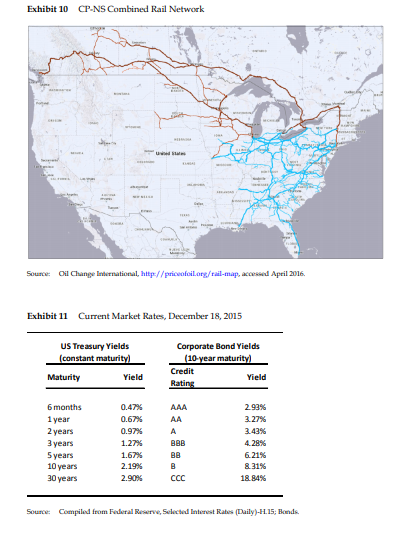
Canadian Pacific's Bid for Norfolk Southern Formed in 1982 out of railroads that had been in existence for 100 years, Norfolk Southern Corporation (NS) had a proud history as one of the largest and most efficient railroads in the United States. Despite this legacy, both revenues and profits began falling in 2015 as shipments of coal (20% of revenues) and other commodities declined and cost reduction efforts stalled. As a result, the company's stock price had fallen by almost 40% from a high of $117 in late 2014 to a low of $72 in August 2015 Rumors that Canadian Pacific Railway Limited (CP) wanted to acquire Norfolk Southern began circulating in the market in early November 2015. Canadian Pacific did, in fact, make an offer to acquire NS on November 17, which the company acknowledged in a press release later that day (note: all amounts in this case refer to U.S. dollars): Norfolk Southern Corporation ("the Company") today confirmed that it has received an unsolicited, low-premium, non-binding, highly conditional indication of interest from Canadian Pacific to acquire the Company for $46.72 in cash and a fixed exchange ratio of 0.348 Canadian Pacific shares per Norfolk Southern share, representing a premium of less than 10% based on closing prices today.... Notably, any consolidation among Class I railroads in North America would face significant regulatory hurdles? Two weeks later, Norfolk Southern's board of directors unanimously rejected the offer, stating After a comprehensive review... the Norfolk Southern board concluded that the indication of interest is grossly inadequate, creates substantial regulatory risks and uncertainties that are highly unlikely to overcome, and is not in the best interest of the Company and its shareholders.... We believe that Canadian Pacific's short-term, cut-to- the-bone strategy could cause Norfolk Southern to lose substantial revenues from our service-sensitive customer base. We also believe the proposed transaction risks harm to vital transportation infrastructure and the communities we serve. In addition to rejecting CP's offer, James Squires, Norfolk Southern's CEO, announced a new strategic plan designed to improve the company's long-term performance by reducing its operating ratio (defined as operating expenses divided by operating revenues - it was an industry measure of cost efficiency). Squires argued that Norfolk Southern could, on a stand-alone basis, reduce its operating ratio from over 70% to below 65% by 2020 through aggressive cost reduction and, in doing so, generate double-digit earnings per share (EPS) growth. Within days of the rejection, Canadian Pacific announced a revised offer and proposed a novel deal structure that would allow operational improvements at Norfolk Southern to be implemented even before the merger received regulatory approval. To further sweeten the deal, CP added a new security known as a Contingent Value Right (CVR) several days later. This security, which CP described as a "long-term insurance policy," was designed to protect investors if the share price of the combined entity fell below a certain level for any reason before the regulators approved the merger. By including the CVR in the deal, CP was demonstrating confidence in its ability to achieve the projected merger benefits. Before Squires and the NS board could respond to CP's "sweetened" offer, however, they had to review the offer with their financial and legal advisors, understand how the merger would affect the firm's operations and impact its shareholders, and prepare a response justifying their decision. That response would not only determine the firm's prospects for many years to come, but could affect Squires's professional reputation and career prospects, as well. The U.S. Railroad Industry The U.S. railroad industry had a long history of regulation starting with the establishment of the Interstate Commerce Commission (ICC) in 1887.6 ICC mandates and other federal regulation limited what railroads could charge on interstate routes, where they could construct new infrastructure, and whether they could divest rail lines. After growing for years, total rail mileage peaked in 1916 as the federal government began subsidizing highway construction. As trucking became an increasingly important form of competition, the share of intercity freight carried by trains fell steadily through the 1950s and 1960s. The 1970s was an especially difficult decade for railroads as inflation caused costs to rise (e.g., fuel, labor, and equipment), yet regulations prevented railroads from raising rates commensurately. The end result was falling returns-the average return on investment (ROI) during the 1970s was 29-and bankruptcies: Penn Central, a Class I railroad, declared bankruptcy in 1970, the largest U.S.corporate bankruptcy at that time. 10 The Staggers Rail Act of 1980 provided much needed relief to U.S. railroads, giving them the flexibility to set their own rates, abandon low-density routes, and make acquisitions with limited scrutiny. 11 In the following years, a flurry of mergers intended to improve service, efficiency, and safety reduced the number of Class I railroads from 56 to 7.12 In this new consolidated environment, railroads regained financial stability as they streamlined operations and cut costs. For example, employment at Class I railroads fell from 458,000 people in 1980 to 178,000 people in 1998; and the industry's average operating ratio fell from 93% to 85%. With higher profitability, the average ROI grew to 7% in the 1990s and then to 9.4% by mid-2015. (Exhibit 1 provides operating and financial statistics for the major railroads operating in the U.S. and Canada as of 2015.) Two important changes occurred in the 1990s. First, the Surface Transportation Board (STB) replaced the ICC as the primary regulator in 1996, and gained the ability to regulate all mergers and acquisitions 15 Second, the rapid consolidation of Class I railroads continued: Burlington Northern with Norfolk Southern as a solution to an escalating bidding war;18 and finally, Canadian National acquired Illinois Central in 1998.19 (Exhibit 2 shows data on railroad acquisitions from 1995-2014.) Rather than enhancing service and improving efficiency as promised, these mergers often disrupted service, increased costs and prices), and reduced safety, at least in the short term, which prompted heightened regulatory scrutiny. For example, after BNSF and Canadian National agreed to merge in December 1999, the STB blocked the merger and froze all major rail mergers for 16 months, beginning in March 2000.21 According to the STB, "the shipping public has not yet fully recovered from the service interruptions associated with the previous round of mergers [from 1995 to 1998)."22 The next year, the STB established rules forbidding all railroad mergers unless they were in the public interest, as it tried to create a stable, balanced, and reliable rail transportation system. "23 Under the new rules, companies had to demonstrate that merging with another railroad would boost competition and maintain service quality.24 An STB spokesman said, "Although our new rules and policy statement do not, as the Class I railroads argue, reflect an anti-merger bias, we do plan to take a more skeptical 'show me' attitude toward claims of merger benefits and toward claims that no transitional problems would occur." At the time, the prevailing view was that another round of consolidation could leave the continent with just two Class I railroads.25 Norfolk Southern Corporation Norfolk Southern Corporation (NS or NSC) was formed in 1982 by the merger of two railways: Norfolk & Western and Southern Railway.7 As the fourth-largest Class I railroad operating in North America, NS had 30,456 employees, controlled 20,000 miles of track in 22 eastern states, and served all of the major East Coast ports. The company generated $2.0 billion of income on operating revenues of $11.6 billion in 2014.2 (Exhibits 3 and 4 show NS's income statements and balance sheets, respectively.) By early 2015, revenues and profits were falling and the firm's relative cost position was deteriorating. After being in the middle of the pack of Class I railroads in terms of its operating ratio, NS was at the high end of the group as of 2015. (Exhibit 5 shows operating ratios over time for Class I railroads). Analysts, however, expected the firm's performance would improve in the coming years. (Exhibit 6 shows financial projections for NS on a stand-alone basis according to equity analysts at UBS in October 2015.) Squires became CEO of NS on June 1, 2015, at the age of 53.31 When former CEO Charles "Wick" Moorman announced his successor, he said, "I am confident that the company is poised for continued growth, success, and shareholder value creation. "32 Squires had joined the company in 1992, as a newly minted graduate of the University of Chicago Law School. He rose through the ranks of the legal division before being named senior vice president of financial planning in 2006, CFO in 2007, and then president in 2013.) BNSF Railway in the US. Midwest. With revenues of $5.7 billion and net income of $1.3 billion in 2014, CP was considerably smaller than NS. (Exhibits 7 and 8 show CP's income statements and balance sheets, respectively.) In 2011, hedge-tund manager and activist investor William Bill" Ackman (HBS 1992) acquired a 12% stake in CP through his firm Pershing Square Capital Management. Ackman was known in the financial world for his overwhelming confidence and his willingness to place enormous bets based on his convictions. For example, he told one author. "I don't care what other people think. I invest based on what I believe the opportunity for profit is compared with my estimate of the potential for loss." Ackman subsequently forced CP's CEO to resign, ousted the company's board of directors, and installed Hunter Harrison as chief executive after a proxy fight." Harrison, a long-term railroad executive, had retired as the CEO of Canadian National (CN) in 2009. During his time at CN, Harrison had won various awards, including Canadian CEO of the Year and Railroader of the Year.44 Harrison believed consolidation was a good way to add critical rail capacity and simultaneously improve efficiency. Toward that end, he had unsuccessfully approached CSX Corp., another Class 1 railroad located in the eastern United States, in 2014 about a possible merger, arguing "A pro competition, customer-friendly, safety-focused railway combination is one such solution that could not be ignored on its merits by regulators." Yet NS's then CEO Moorman said in 2014 that major railroad mergers would be "highly problematic from both a regulatory and a service perspective. Absent mergers, careful cost control could also improve efficiency. In fact, under Harrison's leadership, CP's operating ratio had fallen from 81% in 2011 to close to 60% in 2015. In response, the firm's share price during his tenure had soared from less than $68 at the end of 2011 to almost $215 in October 2014, yet had fallen back down to $135 as of early November 2015.4(CP was traded on both the Toronto and New York stock exchanges.) Bidding for Norfolk Southern Despite market rumors of a possible bid for NS by CP, CP denied the rumors in a press release on November 9, claiming "T]here is no material news pending at this time. CP does not comment on market rumor and speculation. Nevertheless, NS's stock price increased 11.0% (from $79.87 to $88.62) and CP's price increased 5.9% (from $134.31 to $142.18) on a day the market was down 1.0%. Eight days later, after the market closed on November 17, 2015, CP did, in fact, make an offer for NS: Canadian Pacific (CP) ... has sent an offer letter to Norfolk Southern Corp. (NS) proposing a business combination. ... The proposal, which includes a sizable premium in cash and stock offered to NS shareholders, would result in a company with the potential for faster earnings growth than either CP or NS could achieve on their own, all the while maintaining a strong investment grade credit rating.com NS confirmed that it had received an offer from CP to acquire the firm's shares for $46.72 in cash and a fixed exchange ratio of 0.348 CP shares for each NS share. Based on closing stock prices that day, reporters estimated the offer was worth $94.95 per NS share (-$46.72 in cash +0.348 * $138.58). which represented an acquisition premium of 9% over NS's closing price of $86.97.92 The next day, after the market incorporated the news of the proposed acquisition, NS's share price increased 6.3% to $92.49, while CP's price increased 5.4% to $146.65.33 NS responded by saying that in addition to facing "significant regulatory hurdles," the offer was deficient, with a premium of less than 10% over the previous day's closing share price of 586.97.5 CP responded by noting that there had been a significant run-up in NS's share price due to market rumors of the impending bid, and that its offer should be compared to an "unaffected" share price that did not include the effect of the potential merger. In addition, CP argued that the merger would result in significant improvements in operating performance and synergies that should explicitly be recognized when valuing the offer On December 4, 2015, the NS board of directors rejected the CP offer, stating that it was grossly inadequate. CEO Squires said: There is a high probability that, after years of disruption and expense, the proposed combination would be rejected by the Surface Transportation Board.... Even if the proposed combination were ultimately to be cleared, it would be subject to a wide range of onerous conditions that would reduce the value of the stock consideration that has been proposed. Canadian Pacific quickly revised its offer to $32.86 in cash and 0.451 CP shares for each NS share (i.e., less cash and more stock) on December 8. During a conference call that day, Harrison and Ackman gave formal presentations about the proposed merger and took questions from analysts regarding the merits of the proposed combination. A vocal advocate for the merger, Ackman dismissed the NS board's resistance to the deal as similar to the resistance that followed his efforts to install Harrison as CEO of CP in 2012. "I've seen this movie before," he said. Following the second conference call about the deal on December 16, NS and CP closed at $89.79 and $128.56, respectively. (Exhibits 9a and 9b show stock prices for CP and NS from October 1 through December 18.) The Merger Rationale According to CP, the merger provided an opportunity to create a 21 century railroad for a 21 century economy. Although additional rail capacity was desperately needed to meet the demands of a growing economy, it was becoming increasingly difficult to add rail infrastructure in urban areas where most customers were located and railroads exchanged freight with trucks. CP argued that industry consolidation offered the best opportunity to improve efficiency and add incremental capacity without requiring additional infrastructure. Importantly, consolidation would also improve service for shippers Nowhere was the need for additional infrastructure more crucial than in Chicago, Illinois. In 2014, close to 25% of U.S. rail traffic passed through Chicago, and the volume of traffic was expected to double over the next 10 years. Despite various attempts to add infrastructure, the problem was only getting worse. CP argued that the CP-NS merger offered the best opportunity to increase capacity in the critical Chicago train yards Consolidation enables far better utilization of existing infrastructure. For example, trains interchanged in Chicago today must be broken apart and rebuilt in yards within the city and then delivered to receiving carriers. The process involves multiple interchanges between multiple carriers in multiple yards. A merger would allow these activities to be performed elsewhere so that trains moving through Chicago can move smoothly through the city without exiting the mainline. A merger would allow CP- NS to provide end-to-end service to customers, without hand-offs and interchanges. Reducing these disruptive activities can significantly improve velocity, lower costs, and enable the combined company to move goods more quickly without increasing rates 63 In addition to improving efficiency, CP argued that a CP-NS merger would not reduce competition because the two networks met "end-to-end" rather than serving overlapping geographies. (Exhibit 10 shows the combined CP-NS rail network.) However, to address potential regulatory concerns, CP proposed that the new company would give shippers the choice of where they could connect with another railroad along its network, ending the industry practice of "bottleneck pricing i.e., monopoly pricing on routes served by a single railroad) and would allow competing railroads to access its railway if the new company was not providing appropriate service or competitive rates in a particular location. Finally, CP also identified significant opportunities to improve operating efficiencies on the NS system, thereby creating additional value. 45 According to the plan, CP anticipated that the transaction would close by the end of April 2016, and the STB would render a decision to approve (or not) the merger by December 2017. From May 2016 to December 2017, CP and NS would be merged into a "voting trust holding company that would allow the two companies to operate independently. Newly created shares in this holding company (CP-NS shares) would begin trading immediately. Notably, however, CP proposed that Harrison would immediately resign from CP-severing all ties, including his pension and any stock holdings-and would become CEO of NS. This meant that Harrison could immediately start implementing the planned operational improvements at NS, independent of the STB's ultimate decision. If the STB ultimately rejected the merger, then the "improved" Norfolk Southern would be spun off, leaving the companies to operate independently. On the other hand, if the STB ultimately approved the merger, then the combined entity would start realizing CP's projected post-merger combination synergies." CP argued that this novel structure was vital to the transaction, as 72% of its projected operational efficiencies were from pre-merger operational improvements. Table A Projected Merger Benefits (5 millions) 2016 2017 2018 2019 2020 2021 Pre-Merger Operational Improvements Phase-in (X) Increase in EBIT 17% $214 42% $5.29 92% $1,159 100% $1,260 100% $1,260 $844 Post-Merger Combination Synergies Phase-in (%) Increase in EBIT OX $0 0% $0 25% $124 50% $248 75% $371 100% $495 Projected Total increase in CPNS EBIT $214 $529 $968 $1,407 $1,631 $1,755 Source: Canadian Pacific Presentation, "CP Value Proposition. December 8, 2015, p.8. Note The projections were on a pre-tax basis and were not of merger-related costs and other restructuring expenses In total, CP anticipated that the CP-NS merger would generate almost $1.8 billion of annual incremental pre-tax operating profit (earnings before interest and taxes (EBIT)) by 2021. Table A provides CP's projected pre-merger operational improvements and post-merger combination The same type of voting trust structure had been used previously when Canadian National (CN) merged with Mlinois Central (10) in 1999. In the CN-IC merger, I was placed in a voting trust pending STB approval. Hunter Harrison, then CEO OFIC resigned from IC and joined CN as the Chief Operating Officer, allowing the operational improvements at CN to begin almost immediately. When the merger was subsequently approved by the STB, the companies dissolved the voting trust. synergies resulting from the merger. The cash flows were on a pre-tax basis and were net of merger related costs and restructuring expenses. The $1.26 billion of pre-merger operational improvements included improvements in fuel efficiency ($100 million), train productivity ($610 million), and labor productivity ($550 million). The $495 million of post-merger combination synergies included both revenue and cost synergies ($225 million and $270 million, respectively). CP assumed a tax rate of 36% for income earned by NS. CP argued that its assumed tax rate was conservative because, if the STB approved the merger, the overall tax rate of the combined entity could be somewhat lower, These tax savings-expected to be approximately $200 million annually starting in 2018-were mot included in the projections of pre-merger operating improvements and post-merger combination synergies shown in Table A. Finally, CP's CFO Mark Erceg stated that the combined company would initially have a BBB/Baa credit rating (Standard & Poor's/Moody's). However, because of the combined company's strong ability to generate cash flow, he anticipated that its credit rating would rise to BBB+/Baat by 2017, and its debt-to-EBITDA (eamings before interest, taxes, depreciation, and amortization) ratio would fall from 4.0x in 2016 to 16x in 2020. The temporary increase in the combined firm's debt-to-EBITDA ratio and the decline in its credit rating were due to the fact that CP would borrow funds to pay for the entire cash portion of the merger consideration. CP's "Sweetened" Offer On December 16, CP sweetened its revised offer to include 0.451 units of a CVR in addition to the $32.86 in cash and 0.451 CP shares for each NS share it has offered on December & The CVR would expire in October 2017 (18 months after the transaction closed at the end of April 2016 and approximately two months before it expected to receive the final regulatory decision), and would be listed on a major exchange (eg the NYSE). At maturity, each CVR would receive a cash payment equal to $175 minus the CP-NS share price at maturity up to a maximum cash payment of $25.11.72 To determine the value of the CVR, CP used data on current market interest rates (see Exhibit 11). assumed annual stock price volatility for the combined entity of 25%, and assumed that no dividends would be paid between the closing of the transaction and the expiration of the CVR.774 Because the CVR would be highly liquid, NS shareholders could choose to hold the security to maturity or sell it after the transaction closed. Ackman said: [T]hink about this as a long-life insurance policy on the trading price.... It protects you on a downside case.... CP believes that the market will value this combined) company - the way it's run by Hunter-at a meaningfully higher price and that the CVR ultimately will require no payout by CP. So it's the way you put your money where your mouth is.... Canadian Pacific is basically ... saying we're willing to bet $3.4 billion that this stock is above $175 a share (in 2017). Conclusion With a live offer to acquire the firm on the table, Squires had to respond. Before he could respond, however, he and his advisors had to determine how much the sweetened" offer was worth- particularly given the addition of the CVR-and make a recommendation to the NS board members on whether to accept or reject the offer. If they were going to reject the offer, the board had to consider what NS might do next given how quickly it had responded to the prior rejection. If on the other hand, they accepted the offer, they had to consider whether the merger would receive regulatory approval from the STB and what might happen if it did not. Squires needed to prepare answers to the full range of questions the board members were certain to ask concerning the offer, its value, and the ramifications of accepting the deal. Time was short and he had a lot to do. Exhibit 1 Class I Railroad Operating and Financial Performance Metrics ($ millions) Canadian Canadian BNSE National Pacific Railway Railway Railway Kamas City Corp Southern Norfolk Southern Corp Union Pacific Corp 22,543 46,240 9,322 7 12.559 14,600 2.661 150 29,412 5137 31,914 49,652 7,771 5.65 5190 245 34 5451 $3.30 $5.00 $4.00 54.36 Operating Statistics (2014 Miles of Trade Operated (miles) Number of Employees (number Carloads Originated thousands Revenue Ton Mies (RTM) (billions 111 Productivity Measures (2014 Revenue per RTM ( cs) Revenue per Employee (SCM Caricas Origin per Employee Employees per billion RTM Milion RTM per Mile of Track Financial Statistics (9/30/15) Operating Revenues Operating Expenses Operating income Operating Ratio) $2.99 202 $5.67 S3 124 144 146 157 115 12 12 12 17 $22.452 $12,222 $10,126 S.997 S4, 120 $2.463 $1.06 $10,863 $5,44 $3,310 $2,124 80.9% $22,758 $14251 SA. S00 62.6% $3,740 9.4% 68.15 672 712 $7,620 56.218 $5,047 $2,747 EBITDA Net Income Return on Sales (ROS) Return on Equity (DE) $2.586 $1,196 22.0% 40.1% $1,003 $1.06 SARS 19.7% 11.6% $4.540 $1,706 $10.491 $5.086 22.3% 24% 17.8% 25.4% 17.1% $112 $1,008 Assets $3,040 SAOB $21,842 $34,897 38.5% $401 $26,742 S2,828 $10,000 42.0% SER 750 S6, $966 $34,015 $10,105 $11,660 $2,345 S4,184 35.0 $433 $31.27 $1,456 $12.129 $13,319 San 30.3% 88.5% n/a $46,324 $5846 $23, 115 $54357 1610 15.2% $26,225 $26.90 9749 $1,95 5808 $23,027 $76.40 7924 SIS,652 $88.41 855.7 11.6 n/a 12.9% 16.0% Equity (book value] Debt-to-Total Cap (book) Equity market value Stock Prices Shares Outstanding (basic) Avg. Leverage 2 year, market) Avg. Leverage (year market Interest.coverage S&P Credit Rating Equity Beta Vs. S&P 500 Two year weekly Five year monthly Ticker 27.5% 16.6% 26. 7.0 106 125 A 7.2 B&B 142 A 1.28 1.30 134 n/a n/a private 1.15 1.04 ONI 115 102 UN CP KSU NSC Source: Adapted from data from Capital 10. accessed April 2016, Asciation of American Railroads, Analysis of Class I Railroads 2014, Policy and Economics department and case writer estimates [1] Revenue ton miles (KTM) equals the number of tons of paid cargo times the distance hauled in miles. Exhibit 1 Class I Railroad Operating and Financial Performance Metrics ($ millions) Canadian Canadian BNSE National Pacific Railway Railway Railway Kamas City Corp Southern Norfolk Southern Corp Union Pacific Corp 22,543 46,240 9,322 7 12.559 14,600 2.661 150 29,412 5137 31,914 49,652 7,771 5.65 5190 245 34 5451 $3.30 $5.00 $4.00 54.36 Operating Statistics (2014 Miles of Trade Operated (miles) Number of Employees (number Carloads Originated thousands Revenue Ton Mies (RTM) (billions 111 Productivity Measures (2014 Revenue per RTM ( cs) Revenue per Employee (SCM Caricas Origin per Employee Employees per billion RTM Milion RTM per Mile of Track Financial Statistics (9/30/15) Operating Revenues Operating Expenses Operating income Operating Ratio) $2.99 202 $5.67 S3 124 144 146 157 115 12 12 12 17 $22.452 $12,222 $10,126 S.997 S4, 120 $2.463 $1.06 $10,863 $5,44 $3,310 $2,124 80.9% $22,758 $14251 SA. S00 62.6% $3,740 9.4% 68.15 672 712 $7,620 56.218 $5,047 $2,747 EBITDA Net Income Return on Sales (ROS) Return on Equity (DE) $2.586 $1,196 22.0% 40.1% $1,003 $1.06 SARS 19.7% 11.6% $4.540 $1,706 $10.491 $5.086 22.3% 24% 17.8% 25.4% 17.1% $112 $1,008 Assets $3,040 SAOB $21,842 $34,897 38.5% $401 $26,742 S2,828 $10,000 42.0% SER 750 S6, $966 $34,015 $10,105 $11,660 $2,345 S4,184 35.0 $433 $31.27 $1,456 $12.129 $13,319 San 30.3% 88.5% n/a $46,324 $5846 $23, 115 $54357 1610 15.2% $26,225 $26.90 9749 $1,95 5808 $23,027 $76.40 7924 SIS,652 $88.41 855.7 11.6 n/a 12.9% 16.0% Equity (book value] Debt-to-Total Cap (book) Equity market value Stock Prices Shares Outstanding (basic) Avg. Leverage 2 year, market) Avg. Leverage (year market Interest.coverage S&P Credit Rating Equity Beta Vs. S&P 500 Two year weekly Five year monthly Ticker 27.5% 16.6% 26. 7.0 106 125 A 7.2 B&B 142 A 1.28 1.30 134 n/a n/a private 1.15 1.04 ONI 115 102 UN CP KSU NSC Source: Adapted from data from Capital 10. accessed April 2016, Asciation of American Railroads, Analysis of Class I Railroads 2014, Policy and Economics department and case writer estimates [1] Revenue ton miles (KTM) equals the number of tons of paid cargo times the distance hauled in miles. Exhibit 2 Major Railroad Acquisitions and Transaction Multiples, 1995-2014 Total Enterprise Value EBITDA Acquires Target Year 8x 14 14K Burlington Northern Union Pacific Union Pacific Norfolk Southern & CSX Canadian National Canadian National Canadian National Canadian Pacific Berkshire Hathaway Sante Fe Pacific Chicago Northwestern Southern Pacific Conrail Illinois Central Wisconsin Central BC Rail DM&E BNSF 1995 1995 1996 1997 1998 2001 2004 2008 2010 10x 9x 13x Average 10.7% Source: Thomas Wadewitz, Alex Johnson, and Michad Triano, UBS, November 10, 2015 Note: The TEV/EBITDA multiple was based on last (trailing twelve months (LTM) data. LTM (11 Years Ended December 31 2011 2012 2013 2014 Sep 2015 $11,172 $11,040 $11,245 $11,624 $10,863 Operating Revenue Operating Expenses Compensation & benefits Materials, services, and other Fuel Depreciation & amortization Total Operating Expense $2,974 $2,534 $1,589 $862 $7,959 $2,960 $2,463 $1,577 $916 $7,916 $3,002 $2,457 $1,613 $916 $7,988 $2,897 $2,627 $1,574 $951 $8,049 $2,923 $2,713 $1,087 $1.007 $7,730 $3.213 Operating Income Interest expense Unusual items Profit before tax Income tax expense Net Income $455 $160 $2,918 $1,002 $1,916 $3,124 S495 $129 $2,758 $1,009 $1,749 $3,257 $525 $233 $2,965 $1,055 $1,910 $3,575 $545 $104 $3,134 $1,134 $2,000 $3,133 $532 $107 $2,708 $1,002 $1,706 Per Share Items Basic Earnings per share Dividends per share $5.52 $1.66 $5.42 $1.94 $6.1 $2.04 $6.44 $2.22 $5.59 $2.34 Cash Flow Items Capital Expenditures $2,160 $2,241 $1,971 $2,118 $2,516 Financial Ratios and Information Revenue Growth Rate (2) Operating Ratio Effective Tax Rate Retum on Sales (ROS) Number of employees 17.4% 71.2% 34.3% 17.2% 30,329 71.7% 36.6% 15.8% 30,943 1.9% 71.0% 35.6% 17.0% 30,103 69.2% 36.2% 17.2% 29,482 -6.6% 71.2% 37.0% 15.7% 30,456 Source: Adapted from data from Capital IQ accessed April 2016 [1Last twelve months (LTM)ending September 30, 2015 [2] For 2015, growth rate is calculated from previous LTM ending Sember 2014. LTM (11 Years Ended December 31 2011 2012 2013 2014 Sep 2015 $11,172 $11,040 $11,245 $11,624 $10,863 Operating Revenue Operating Expenses Compensation & benefits Materials, services, and other Fuel Depreciation & amortization Total Operating Expense $2,974 $2,534 $1,589 $862 $7,959 $2,960 $2,463 $1,577 $916 $7,916 $3,002 $2,457 $1,613 $916 $7,988 $2,897 $2,627 $1,574 $951 $8,049 $2,923 $2,713 $1,087 $1.007 $7,730 $3.213 Operating Income Interest expense Unusual items Profit before tax Income tax expense Net Income $455 $160 $2,918 $1,002 $1,916 $3,124 S495 $129 $2,758 $1,009 $1,749 $3,257 $525 $233 $2,965 $1,055 $1,910 $3,575 $545 $104 $3,134 $1,134 $2,000 $3,133 $532 $107 $2,708 $1,002 $1,706 Per Share Items Basic Earnings per share Dividends per share $5.52 $1.66 $5.42 $1.94 $6.1 $2.04 $6.44 $2.22 $5.59 $2.34 Cash Flow Items Capital Expenditures $2,160 $2,241 $1,971 $2,118 $2,516 Financial Ratios and Information Revenue Growth Rate (2) Operating Ratio Effective Tax Rate Retum on Sales (ROS) Number of employees 17.4% 71.2% 34.3% 17.2% 30,329 71.7% 36.6% 15.8% 30,943 1.9% 71.0% 35.6% 17.0% 30,103 69.2% 36.2% 17.2% 29,482 -6.6% 71.2% 37.0% 15.7% 30,456 Source: Adapted from data from Capital IQ accessed April 2016 [1Last twelve months (LTM)ending September 30, 2015 [2] For 2015, growth rate is calculated from previous LTM ending Sember 2014. Exhibit 4 Norfolk Southern Balance Sheets, 2011-2015 ($ millions) Sept Years Ended December 31 2011 2013 2012 2014 2015 Assets Cash and ST investments Accounts receiveable Inventory Other current assets Total current assets Net PP&E Investments Other LT Assets Total assets $301 $1,022 $209 $219 $1,751 $24,469 $2,234 $84 $28,538 $668 $1,109 $216 $249 $2,242 $25,736 $2,300 $64 $30,342 $1,561 $1,024 $223 $267 $3,075 $26,645 $2,439 $324 $32,483 $973 $1,055 $236 $514 $2,778 $27,694 $2,679 $49 $33,200 $433 $1,103 $288 $178 $2,002 $28,682 $2,740 $103 $33,527 Liabilities and stock holders' equity Accounts payable Short-term debt Current maturities of LT debt Other current liabilities Total current liabilities Long-term debt Other liabilities Deferred income taxes Total Liabilities Sharholders equity Total liabilities & equity $1,092 $100 $50 $459 $1,701 $7,390 $2,050 $7,486 $18,627 $9,911 $28,538 $1,362 $200 $50 $469 $2,081 $8,432 $2,237 $7,832 $20,582 $9,760 $30,342 $1,265 $100 $445 $495 $2,305 $8.903 $1,444 $8,542 $21,194 $11,289 $32,483 $1,233 $100 $2 $445 $1,780 $8,883 $1,312 $8,817 $20,792 $12,408 $33,200 $1,160 $100 $500 $607 $2,367 $8,896 $1,295 $8,840 $21,398 $12,129 $33,527 Financial Ratios & Other Information Current Ratio Debt-to-Total Capital S&P Long-term Debt Rating Shares outstanding Stock price per share 1.03 43.2% 388+ 330.1 72.86 1.08 47.1% BBB+ 314.5 61.84 1.33 45.6% BBB+ 309.7 92.83 156 42.0% BBB+ 307.4 109.61 0.85 43.9% BBB+ 301.4 76.40 Source: Adapted from data from Capital I. accessed April 2016, Note: The September figure is for the last twelve months ending September 30, 2015 Exhibit 5 Operating Ratios for Class I Railroads, 2006-2015 85% 80% 75% 70% 65% 60% 55% 2012 2013 2006 2007 2008 2009 CSX -NS ... CNI 2010 2011 -BNSF 2014 2015est CP UNP -KCS Source: Canadian Pacific Presentation, "CP. Value Proposition" December 8, 2015, p. 6. Capital 10. accessed April 2016; and casewriter estimates Exhibit 6 Norfolk Southern Projections on a Stand-alone Basis, October 2015 ($ millions) Projected (period ending 12/31) 2017 2018 2019 2020 2015 2016 2021 $10,649 $11,671 Income statement items Revenue Growth rate(%) Operating expenses Depreciation (1) EBIT Operating ratio $6,548 $1,049 $3,052 71% $10,698 0.5% $6,397 $1,091 $2,210 70% $11,175 4.5% $6,570 $1,135 $3,470 69% $6,808 $1,180 $3,683 $12,191 $12,557 $12,871 4.5% 3.0% 2.5% $7,049 $7,139 $7,440 $1,227 $1,300 $1,313 $3.915 $4,118 $4,118 67% 68% 68% Balance sheet items Capital expenditures Networking capital (2) $2,365 ( ($192) $2,070 ($128) $1,910 ($134) $1,930 ($140) $1,930 ($146) $1,949 ($151) $1,969 ($154) Source: Compiled from LIES Global Research, Norfolk Southern Corporation, October 28, 2015, and case writer estimates. [1] Because the expected useful life of a railroad's fixed assets was very long (up to 40 years) and depreciation was based on historical cost, the ratio of Cap Exto Depreciation was typically greater than one. Historically, the average ratio of Cap Ex to Depreciation for Norfolk Southern was about 1.5. The historical ratio of Cap Ex to Depreciation of 15 was expected to hold during the period after 2121. 12The love of met working capital equals the sum of accounts receivable, inventory, and other current ces minus the sum of accounts payable and other current liabilities Exhibit 7 Canadian Pacific Railway Income Statements, 2011-2015 ($ millions) Years Ended December 31 2011 2012 2013 2014 LTM (11 Sep 2015 $5,092 $5,714 $5,773 $5,716 $5,434 Operating Revenue Operating Expenses Compensation & benefits Materials, services, and other Fuel Depreciation & amortization Total Operating Expense $1,403 $1,304 $952 $482 $4,141 $1,479 $1,421 $1,002 $541 $4,443 $1,297 $1,253 $945 $532 $4,027 $1,164 $1,151 $905 $477 $3,697 $1,079 $1,125 $643 $463 $3,310 $1,271 $277 Operating Income Interest expense Unusual items Profit before tax Income tax expense Net Income $951 $248 ($19) $686 $125 $561 $1,746 $262 ($426 $1,059 $235 $824 $2,020 $244 ($16 $1,760 $485 $1,274 $2,124 $274 ($141) $1,708 $S12 $1,196 $638 $153 $485 Per Share Items Basic Earnings per share Dividends per share $3.31 $1.15 $2.83 $1.35 $4.71 $1.32 $7.37 $1.21 $7.27 $1.12 Cash Flow Items Capital Expenditures $1,096 $1,152 $1,163 $1,251 $1,210 Financial Ratios and Information Revenue Growth Rate [2] Operating Ratio Effective Tax Rate Return on Sales (ROS) Number of employees 1.7% 81.3% 18.2% 11.0% 14, 169 12.2% 77.8% 22.9% 8.5% 14,594 1.0% 69.8% 22.2% 14.3% 14,977 -1.0% 64.7% 27.6% 22.3% 14,698 -8.7% 60.9% 30.0% 22.0% 14,698 Source: Adapted from data from Capital 10 accessed April 2016. [1] Last twelve months (LTM) ending September 30, 2015. 12 For 2015. growth rate is calculated from previous LTM ending September 2014 Exhibit 8 Canadian Pacific Railway Balance Sheets, 2011-2015 ($ millions) Years Ended December 31 2011 2012 2013 Sept 2015 2014 Assets Cash and ST investments Accounts receiveable Inventory Other current assets Total current assets Net PP&E Investments Other LT Assets Total assets $46 $334 $448 $195 $510 $548 $546 $606 $136 $136 $155 $153 $151 $315 $761 $100 $842 $1,333 $1,910 $1,054 $12,544 $13,055 $12,545 $12,467 $ $164 $83 $87 $97 $330 $303 $1,483 $13,880 $14,775 $16,024 $14,291 $493 $539 $130 $110 $1,273 $11,766 $107 $612 $13,759 $673 $54 Liabilities and stock holders' equi Accounts payable Short-term debt Current maturities of LT debt Other current liabilities Total current liabilities Long-term debt Other liabilities Deferred income taxes Total Liabilities Sharholders equity Total liabilities & equity 0.0% $381 $27 $49 $733 $1,190 $4,618 $1,709 $1,789 $9,307 $4,573 $ $13,880 0.0% 0.0% $322 $337 $0 $0 $0 $178 $858 $782 $1,234 $1,297 $4,651 $4,377 $1,677 $937 $2,099 $2,733 $9,661 $9,343 $5,114 $6,680 $14,775 $16,024 0.0% $351 $0 $116 $752 $1,218 $4,857 $1,025 $2,346 $9,447 $4,844 $14,291 0.0% $271 $0 $22 $914 $1,206 $6,456 $826 $2,291 $10,779 $2.980 $13,759 Financial Ratios & Other Information Current Ratio Debt-to-Total Capital S&P Long-term Debt Rating Shares outstanding Stock price per share 0.71 50.7% BBB 170.4 67.67 1.08 47.9% BBB- 174.2 101.62 1.47 40.5% BBB- 175.2 151.32 0.87 50.7% BBB+ 171.0 192.69 1.06 68.5% BBB+ 161.0 143.57 Exhibit 9a Stock Prices for Norfolk Southern and Canadian Pacific (in US dollars) Stock Price $100 $95 $90 $85 $80 $75 $70 NSC $65 ---(Indexed to NSC on 10/1/15) Market Indexed to NSC on 10/1/15) $60 10/1 19/8 10/15 10/22 10/29 11/5 11/12 11/19 11/26 12/3 12/10 12/17 Source: Caserwriter analysis using data from the Center for Research in Security Prices, accessed April 2016 Exhibit 9b Selected Stock Prices for Norfolk Southern and Canadian Pacific (in US dollars) Period Beg Timeline Event NS Stock Price Beg End Change End CP Stock Price Beg End Change $2.54 8.75 (1.65) 5.52 10/01/15 - 11/06/15 11/06/15 - 11/09/15 Merger Rumors 11/09/15 - 11/17/15 11/17/15 - 11/18/15 Initial CP Offer 11/18/15 - 12/03/15 12/03/15 - 12/04/15 NS Rejects Offer 12/04/15 - 12/07/15 12/07/15 - 12/08/15 Revised CP Offer 12/08/15 - 12/18/15 $77.33 $79.87 79.87 88.62 88.62 96.97 86.97 92.49 92.49 93.11 93.11 92.06 92.06 91.52 91.52 96.32 86.32 84.27 $146.36 $134.31 ($12.05) 134.31 142.18 7.87 142.18 138.58 (3.60) 138.58 146.65 8.07 146.65 140.91 (5.74 140.91 134.49 (6.42) 134,49 130.48 (4.01) 130.48 126.13 (4.35) 126.13 125.07 (1.06) (1.05) (0.54 (5.20) (2.05) Source: Casewriter analysis using data from the Center for Research in Security Prices, accessed April 2016, Exhibit 10 CPNS Combined Rail Network Source: Oll Change International, http://priceofoil.org/tail-map, accessed April 2016, Exhibit 11 Current Market Rates, December 18, 2015 US Treasury Yields constant maturity) Maturity Yield Corporate Bond Yields (10-year maturity Credit Yield Rating 6 months 1 year 2 years 3 years 5 years 10 years 30 years 0.47% 0.67% 0.97% 1.27% 1.67% 2.19% 2.90% AAA AA A BBB BB B CCC 2.93% 3.27% 3.43% 4.28% 6.21% 8.31% 18.84% Source: Compiled from Federal Reserve, Selected Interest Rates (Daily)-H.15: Bonds. Canadian Pacific's Bid for Norfolk Southern Formed in 1982 out of railroads that had been in existence for 100 years, Norfolk Southern Corporation (NS) had a proud history as one of the largest and most efficient railroads in the United States. Despite this legacy, both revenues and profits began falling in 2015 as shipments of coal (20% of revenues) and other commodities declined and cost reduction efforts stalled. As a result, the company's stock price had fallen by almost 40% from a high of $117 in late 2014 to a low of $72 in August 2015 Rumors that Canadian Pacific Railway Limited (CP) wanted to acquire Norfolk Southern began circulating in the market in early November 2015. Canadian Pacific did, in fact, make an offer to acquire NS on November 17, which the company acknowledged in a press release later that day (note: all amounts in this case refer to U.S. dollars): Norfolk Southern Corporation ("the Company") today confirmed that it has received an unsolicited, low-premium, non-binding, highly conditional indication of interest from Canadian Pacific to acquire the Company for $46.72 in cash and a fixed exchange ratio of 0.348 Canadian Pacific shares per Norfolk Southern share, representing a premium of less than 10% based on closing prices today.... Notably, any consolidation among Class I railroads in North America would face significant regulatory hurdles? Two weeks later, Norfolk Southern's board of directors unanimously rejected the offer, stating After a comprehensive review... the Norfolk Southern board concluded that the indication of interest is grossly inadequate, creates substantial regulatory risks and uncertainties that are highly unlikely to overcome, and is not in the best interest of the Company and its shareholders.... We believe that Canadian Pacific's short-term, cut-to- the-bone strategy could cause Norfolk Southern to lose substantial revenues from our service-sensitive customer base. We also believe the proposed transaction risks harm to vital transportation infrastructure and the communities we serve. In addition to rejecting CP's offer, James Squires, Norfolk Southern's CEO, announced a new strategic plan designed to improve the company's long-term performance by reducing its operating ratio (defined as operating expenses divided by operating revenues - it was an industry measure of cost efficiency). Squires argued that Norfolk Southern could, on a stand-alone basis, reduce its operating ratio from over 70% to below 65% by 2020 through aggressive cost reduction and, in doing so, generate double-digit earnings per share (EPS) growth. Within days of the rejection, Canadian Pacific announced a revised offer and proposed a novel deal structure that would allow operational improvements at Norfolk Southern to be implemented even before the merger received regulatory approval. To further sweeten the deal, CP added a new security known as a Contingent Value Right (CVR) several days later. This security, which CP described as a "long-term insurance policy," was designed to protect investors if the share price of the combined entity fell below a certain level for any reason before the regulators approved the merger. By including the CVR in the deal, CP was demonstrating confidence in its ability to achieve the projected merger benefits. Before Squires and the NS board could respond to CP's "sweetened" offer, however, they had to review the offer with their financial and legal advisors, understand how the merger would affect the firm's operations and impact its shareholders, and prepare a response justifying their decision. That response would not only determine the firm's prospects for many years to come, but could affect Squires's professional reputation and career prospects, as well. The U.S. Railroad Industry The U.S. railroad industry had a long history of regulation starting with the establishment of the Interstate Commerce Commission (ICC) in 1887.6 ICC mandates and other federal regulation limited what railroads could charge on interstate routes, where they could construct new infrastructure, and whether they could divest rail lines. After growing for years, total rail mileage peaked in 1916 as the federal government began subsidizing highway construction. As trucking became an increasingly important form of competition, the share of intercity freight carried by trains fell steadily through the 1950s and 1960s. The 1970s was an especially difficult decade for railroads as inflation caused costs to rise (e.g., fuel, labor, and equipment), yet regulations prevented railroads from raising rates commensurately. The end result was falling returns-the average return on investment (ROI) during the 1970s was 29-and bankruptcies: Penn Central, a Class I railroad, declared bankruptcy in 1970, the largest U.S.corporate bankruptcy at that time. 10 The Staggers Rail Act of 1980 provided much needed relief to U.S. railroads, giving them the flexibility to set their own rates, abandon low-density routes, and make acquisitions with limited scrutiny. 11 In the following years, a flurry of mergers intended to improve service, efficiency, and safety reduced the number of Class I railroads from 56 to 7.12 In this new consolidated environment, railroads regained financial stability as they streamlined operations and cut costs. For example, employment at Class I railroads fell from 458,000 people in 1980 to 178,000 people in 1998; and the industry's average operating ratio fell from 93% to 85%. With higher profitability, the average ROI grew to 7% in the 1990s and then to 9.4% by mid-2015. (Exhibit 1 provides operating and financial statistics for the major railroads operating in the U.S. and Canada as of 2015.) Two important changes occurred in the 1990s. First, the Surface Transportation Board (STB) replaced the ICC as the primary regulator in 1996, and gained the ability to regulate all mergers and acquisitions 15 Second, the rapid consolidation of Class I railroads continued: Burlington Northern with Norfolk Southern as a solution to an escalating bidding war;18 and finally, Canadian National acquired Illinois Central in 1998.19 (Exhibit 2 shows data on railroad acquisitions from 1995-2014.) Rather than enhancing service and improving efficiency as promised, these mergers often disrupted service, increased costs and prices), and reduced safety, at least in the short term, which prompted heightened regulatory scrutiny. For example, after BNSF and Canadian National agreed to merge in December 1999, the STB blocked the merger and froze all major rail mergers for 16 months, beginning in March 2000.21 According to the STB, "the shipping public has not yet fully recovered from the service interruptions associated with the previous round of mergers [from 1995 to 1998)."22 The next year, the STB established rules forbidding all railroad mergers unless they were in the public interest, as it tried to create a stable, balanced, and reliable rail transportation system. "23 Under the new rules, companies had to demonstrate that merging with another railroad would boost competition and maintain service quality.24 An STB spokesman said, "Although our new rules and policy statement do not, as the Class I railroads argue, reflect an anti-merger bias, we do plan to take a more skeptical 'show me' attitude toward claims of merger benefits and toward claims that no transitional problems would occur." At the time, the prevailing view was that another round of consolidation could leave the continent with just two Class I railroads.25 Norfolk Southern Corporation Norfolk Southern Corporation (NS or NSC) was formed in 1982 by the merger of two railways: Norfolk & Western and Southern Railway.7 As the fourth-largest Class I railroad operating in North America, NS had 30,456 employees, controlled 20,000 miles of track in 22 eastern states, and served all of the major East Coast ports. The company generated $2.0 billion of income on operating revenues of $11.6 billion in 2014.2 (Exhibits 3 and 4 show NS's income statements and balance sheets, respectively.) By early 2015, revenues and profits were falling and the firm's relative cost position was deteriorating. After being in the middle of the pack of Class I railroads in terms of its operating ratio, NS was at the high end of the group as of 2015. (Exhibit 5 shows operating ratios over time for Class I railroads). Analysts, however, expected the firm's performance would improve in the coming years. (Exhibit 6 shows financial projections for NS on a stand-alone basis according to equity analysts at UBS in October 2015.) Squires became CEO of NS on June 1, 2015, at the age of 53.31 When former CEO Charles "Wick" Moorman announced his successor, he said, "I am confident that the company is poised for continued growth, success, and shareholder value creation. "32 Squires had joined the company in 1992, as a newly minted graduate of the University of Chicago Law School. He rose through the ranks of the legal division before being named senior vice president of financial planning in 2006, CFO in 2007, and then president in 2013.) BNSF Railway in the US. Midwest. With revenues of $5.7 billion and net income of $1.3 billion in 2014, CP was considerably smaller than NS. (Exhibits 7 and 8 show CP's income statements and balance sheets, respectively.) In 2011, hedge-tund manager and activist investor William Bill" Ackman (HBS 1992) acquired a 12% stake in CP through his firm Pershing Square Capital Management. Ackman was known in the financial world for his overwhelming confidence and his willingness to place enormous bets based on his convictions. For example, he told one author. "I don't care what other people think. I invest based on what I believe the opportunity for profit is compared with my estimate of the potential for loss." Ackman subsequently forced CP's CEO to resign, ousted the company's board of directors, and installed Hunter Harrison as chief executive after a proxy fight." Harrison, a long-term railroad executive, had retired as the CEO of Canadian National (CN) in 2009. During his time at CN, Harrison had won various awards, including Canadian CEO of the Year and Railroader of the Year.44 Harrison believed consolidation was a good way to add critical rail capacity and simultaneously improve efficiency. Toward that end, he had unsuccessfully approached CSX Corp., another Class 1 railroad located in the eastern United States, in 2014 about a possible merger, arguing "A pro competition, customer-friendly, safety-focused railway combination is one such solution that could not be ignored on its merits by regulators." Yet NS's then CEO Moorman said in 2014 that major railroad mergers would be "highly problematic from both a regulatory and a service perspective. Absent mergers, careful cost control could also improve efficiency. In fact, under Harrison's leadership, CP's operating ratio had fallen from 81% in 2011 to close to 60% in 2015. In response, the firm's share price during his tenure had soared from less than $68 at the end of 2011 to almost $215 in October 2014, yet had fallen back down to $135 as of early November 2015.4(CP was traded on both the Toronto and New York stock exchanges.) Bidding for Norfolk Southern Despite market rumors of a possible bid for NS by CP, CP denied the rumors in a press release on November 9, claiming "T]here is no material news pending at this time. CP does not comment on market rumor and speculation. Nevertheless, NS's stock price increased 11.0% (from $79.87 to $88.62) and CP's price increased 5.9% (from $134.31 to $142.18) on a day the market was down 1.0%. Eight days later, after the market closed on November 17, 2015, CP did, in fact, make an offer for NS: Canadian Pacific (CP) ... has sent an offer letter to Norfolk Southern Corp. (NS) proposing a business combination. ... The proposal, which includes a sizable premium in cash and stock offered to NS shareholders, would result in a company with the potential for faster earnings growth than either CP or NS could achieve on their own, all the while maintaining a strong investment grade credit rating.com NS confirmed that it had received an offer from CP to acquire the firm's shares for $46.72 in cash and a fixed exchange ratio of 0.348 CP shares for each NS share. Based on closing stock prices that day, reporters estimated the offer was worth $94.95 per NS share (-$46.72 in cash +0.348 * $138.58). which represented an acquisition premium of 9% over NS's closing price of $86.97.92 The next day, after the market incorporated the news of the proposed acquisition, NS's share price increased 6.3% to $92.49, while CP's price increased 5.4% to $146.65.33 NS responded by saying that in addition to facing "significant regulatory hurdles," the offer was deficient, with a premium of less than 10% over the previous day's closing share price of 586.97.5 CP responded by noting that there had been a significant run-up in NS's share price due to market rumors of the impending bid, and that its offer should be compared to an "unaffected" share price that did not include the effect of the potential merger. In addition, CP argued that the merger would result in significant improvements in operating performance and synergies that should explicitly be recognized when valuing the offer On December 4, 2015, the NS board of directors rejected the CP offer, stating that it was grossly inadequate. CEO Squires said: There is a high probability that, after years of disruption and expense, the proposed combination would be rejected by the Surface Transportation Board.... Even if the proposed combination were ultimately to be cleared, it would be subject to a wide range of onerous conditions that would reduce the value of the stock consideration that has been proposed. Canadian Pacific quickly revised its offer to $32.86 in cash and 0.451 CP shares for each NS share (i.e., less cash and more stock) on December 8. During a conference call that day, Harrison and Ackman gave formal presentations about the proposed merger and took questions from analysts regarding the merits of the proposed combination. A vocal advocate for the merger, Ackman dismissed the NS board's resistance to the deal as similar to the resistance that followed his efforts to install Harrison as CEO of CP in 2012. "I've seen this movie before," he said. Following the second conference call about the deal on December 16, NS and CP closed at $89.79 and $128.56, respectively. (Exhibits 9a and 9b show stock prices for CP and NS from October 1 through December 18.) The Merger Rationale According to CP, the merger provided an opportunity to create a 21 century railroad for a 21 century economy. Although additional rail capacity was desperately needed to meet the demands of a growing economy, it was becoming increasingly difficult to add rail infrastructure in urban areas where most customers were located and railroads exchanged freight with trucks. CP argued that industry consolidation offered the best opportunity to improve efficiency and add incremental capacity without requiring additional infrastructure. Importantly, consolidation would also improve service for shippers Nowhere was the need for additional infrastructure more crucial than in Chicago, Illinois. In 2014, close to 25% of U.S. rail traffic passed through Chicago, and the volume of traffic was expected to double over the next 10 years. Despite various attempts to add infrastructure, the problem was only getting worse. CP argued that the CP-NS merger offered the best opportunity to increase capacity in the critical Chicago train yards Consolidation enables far better utilization of existing infrastructure. For example, trains interchanged in Chicago today must be broken apart and rebuilt in yards within the city and then delivered to receiving carriers. The process involves multiple interchanges between multiple carriers in multiple yards. A merger would allow these activities to be performed elsewhere so that trains moving through Chicago can move smoothly through the city without exiting the mainline. A merger would allow CP- NS to provide end-to-end service to customers, without hand-offs and interchanges. Reducing these disruptive activities can significantly improve velocity, lower costs, and enable the combined company to move goods more quickly without increasing rates 63 In addition to improving efficiency, CP argued that a CP-NS merger would not reduce competition because the two networks met "end-to-end" rather than serving overlapping geographies. (Exhibit 10 shows the combined CP-NS rail network.) However, to address potential regulatory concerns, CP proposed that the new company would give shippers the choice of where they could connect with another railroad along its network, ending the industry practice of "bottleneck pricing i.e., monopoly pricing on routes served by a single railroad) and would allow competing railroads to access its railway if the new company was not providing appropriate service or competitive rates in a particular location. Finally, CP also identified significant opportunities to improve operating efficiencies on the NS system, thereby creating additional value. 45 According to the plan, CP anticipated that the transaction would close by the end of April 2016, and the STB would render a decision to approve (or not) the merger by December 2017. From May 2016 to December 2017, CP and NS would be merged into a "voting trust holding company that would allow the two companies to operate independently. Newly created shares in this holding company (CP-NS shares) would begin trading immediately. Notably, however, CP proposed that Harrison would immediately resign from CP-severing all ties, including his pension and any stock holdings-and would become CEO of NS. This meant that Harrison could immediately start implementing the planned operational improvements at NS, independent of the STB's ultimate decision. If the STB ultimately rejected the merger, then the "improved" Norfolk Southern would be spun off, leaving the companies to operate independently. On the other hand, if the STB ultimately approved the merger, then the combined entity would start realizing CP's projected post-merger combination synergies." CP argued that this novel structure was vital to the transaction, as 72% of its projected operational efficiencies were from pre-merger operational improvements. Table A Projected Merger Benefits (5 millions) 2016 2017 2018 2019 2020 2021 Pre-Merger Operational Improvements Phase-in (X) Increase in EBIT 17% $214 42% $5.29 92% $1,159 100% $1,260 100% $1,260 $844 Post-Merger Combination Synergies Phase-in (%) Increase in EBIT OX $0 0% $0 25% $124 50% $248 75% $371 100% $495 Projected Total increase in CPNS EBIT $214 $529 $968 $1,407 $1,631 $1,755 Source: Canadian Pacific Presentation, "CP Value Proposition. December 8, 2015, p.8. Note The projections were on a pre-tax basis and were not of merger-related costs and other restructuring expenses In total, CP anticipated that the CP-NS merger would generate almost $1.8 billion of annual incremental pre-tax operating profit (earnings before interest and taxes (EBIT)) by 2021. Table A provides CP's projected pre-merger operational improvements and post-merger combination The same type of voting trust structure had been used previously when Canadian National (CN) merged with Mlinois Central (10) in 1999. In the CN-IC merger, I was placed in a voting trust pending STB approval. Hunter Harrison, then CEO OFIC resigned from IC and joined CN as the Chief Operating Officer, allowing the operational improvements at CN to begin almost immediately. When the merger was subsequently approved by the STB, the companies dissolved the voting trust. synergies resulting from the merger. The cash flows were on a pre-tax basis and were net of merger related costs and restructuring expenses. The $1.26 billion of pre-merger operational improvements included improvements in fuel efficiency ($100 million), train productivity ($610 million), and labor productivity ($550 million). The $495 million of post-merger combination synergies included both revenue and cost synergies ($225 million and $270 million, respectively). CP assumed a tax rate of 36% for income earned by NS. CP argued that its assumed tax rate was conservative because, if the STB approved the merger, the overall tax rate of the combined entity could be somewhat lower, These tax savingsStep by Step Solution
There are 3 Steps involved in it
Step: 1

Get Instant Access to Expert-Tailored Solutions
See step-by-step solutions with expert insights and AI powered tools for academic success
Step: 2

Step: 3
Ace Your Homework with AI
Get the answers you need in no time with our AI-driven, step-by-step assistance
Get Started
Wealth Mastery Unveiled By Marcus M Dawson A Millennial S Guide To Financial Freedom And Success
Authors: Marcus M. Dawson
1st Edition
979-8865054313