What is the probability of an underfill, that is, Prob (X
ans. 7.3 %
Need help figuring out how to get the answer above
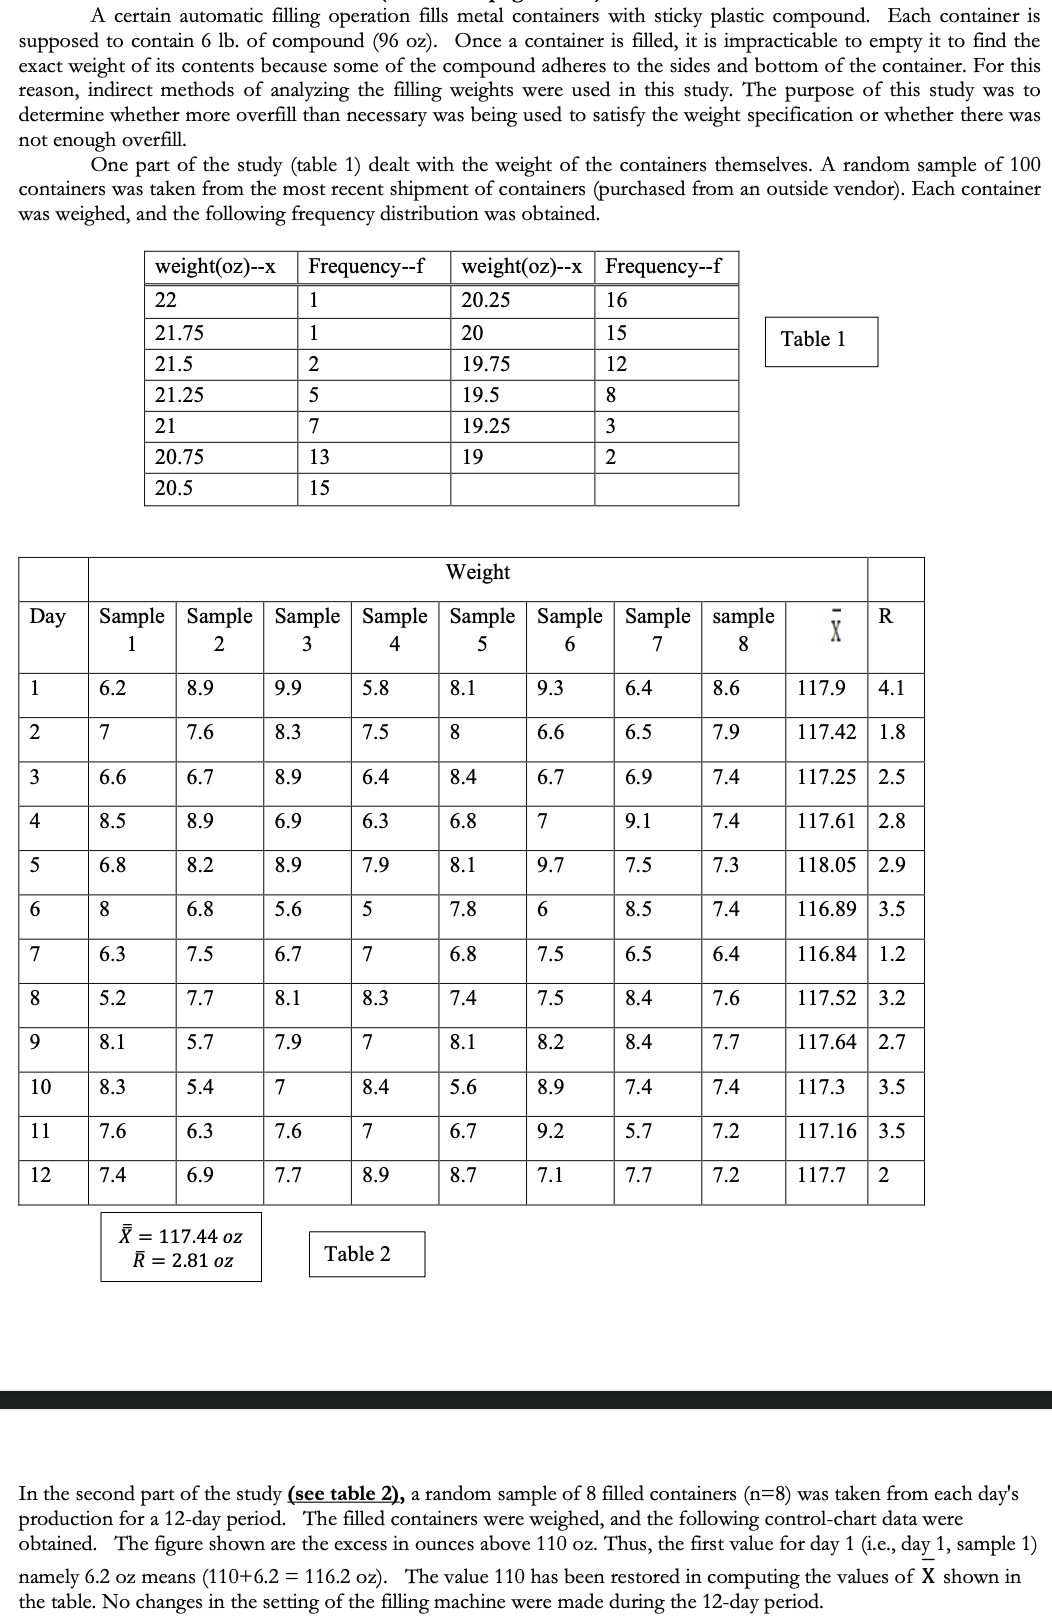
A certain automatic filling operation fills metal containers with sticky plastic compound. Each container is supposed to contain 6 1b. of compound (96 oz). Once a container is filled, it is impracticably to empty it to find the exact weight of its contents because some of the compound adheres to the sides and bottom of the container. For this reason, indirect methods of analyzing the filling weights were used in this study. The purpose of this study was to determine whether more overfill than necessary was being used to satisfy the weight specification or whether there was not enough overfill. One part of the study (table 1) dealt with the weight of the containers themselves. A random sample of 100 containers was taken from the most recent shipment of containers (purchased from an outside vendor). Each container was weighed, and the following frequency distribution was obtained. weight(oz)--x Frequency--f weight(oz)--x Frequency--f 22 20.25 16 21.75 20 15 Table 1 21.5 2 19.75 12 21.25 5 19.5 8 21 7 19.25 3 20.75 13 19 2 20.5 15 Weight Day Sample Sample Sample Sample Sample Sample Sample sample R 2 8 6.2 8.9 9.9 5.8 8.1 9.3 6.4 8.6 117.9 4.1 2 7 7.6 8.3 7.5 8 6.6 6.5 7.9 117.42 1.8 3 6.6 6.7 8.9 6.4 8.4 6.7 6.9 7.4 117.25 2.5 4 8.5 8.9 6.9 6.3 6.8 7 9.1 7.4 117.61 2.8 6.8 8.2 8.9 7.9 8.1 9.7 7.5 7.3 118.05 2.9 6 8 6.8 5.6 5 7.8 6 8.5 7.4 116.89 3.5 7 6.3 7.5 6.7 7 6.8 7.5 6.5 6.4 116.84 1.2 5.2 7.7 8.1 8.3 7.4 7.5 8.4 7.6 117.52 3.2 8.1 5.7 7.9 7 8.1 8.2 8.4 7.7 117.64 2.7 10 8.3 5.4 7 8.4 5.6 8.9 7.4 7.4 117.3 3.5 1 1 7.6 6.3 7.6 7 6.7 9.2 5.7 7.2 117.16 3.5 12 7.4 6.9 7.7 8.9 8.7 7.1 7.7 7.2 117.7 2 X = 117.44 oz R = 2.81 oz Table 2 In the second part of the study (see table 2), a random sample of 8 filled containers (n=8) was taken from each day's production for a 12-day period. The filled containers were weighed, and the following control-chart data were obtained. The figure shown are the excess in ounces above 110 oz. Thus, the first value for day 1 (i.e., day 1, sample 1) namely 6.2 oz means (110+6.2 = 116.2 oz). The value 110 has been restored in computing the values of X shown in the table. No changes in the setting of the filling machine were made during the 12-day period


