what is the return of assets ratio for Hasbro, must show excel formula.
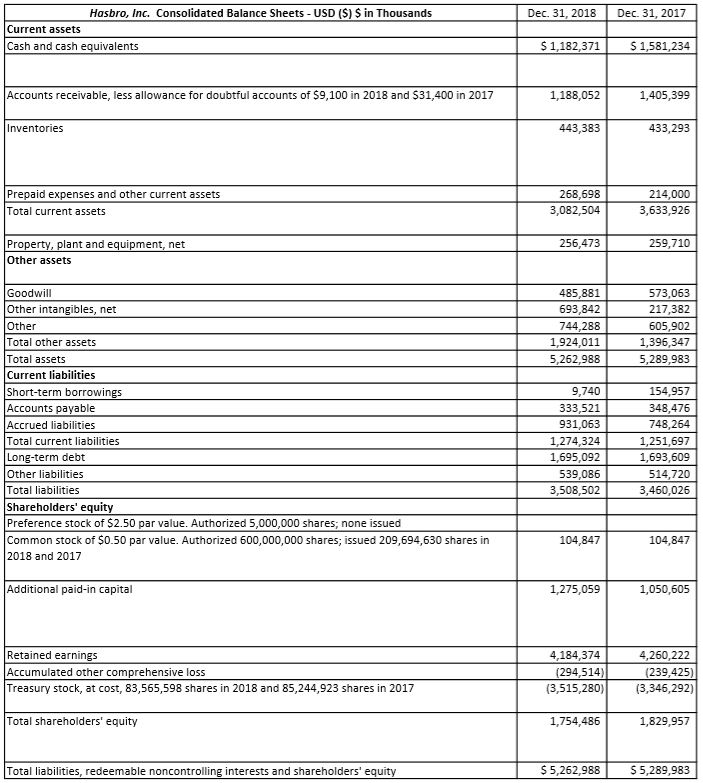
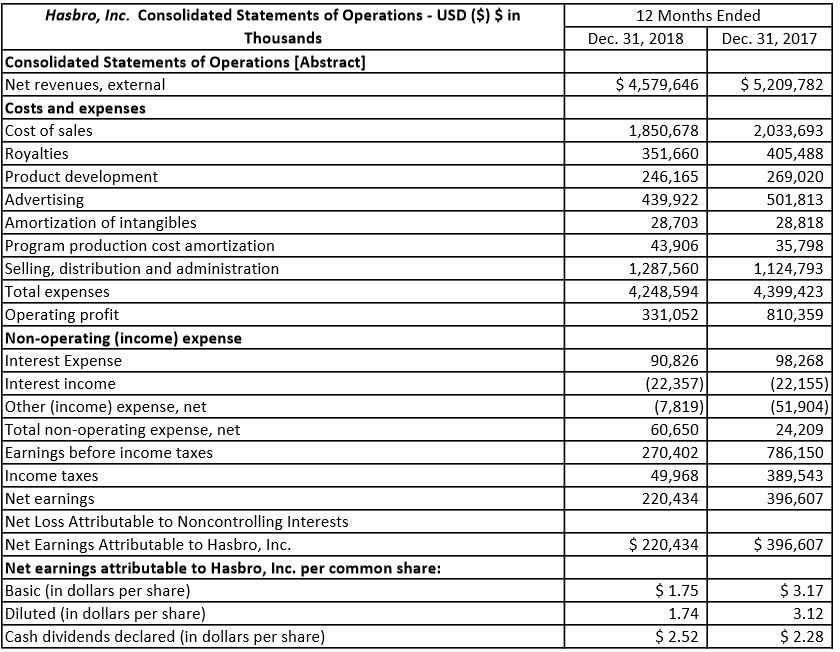
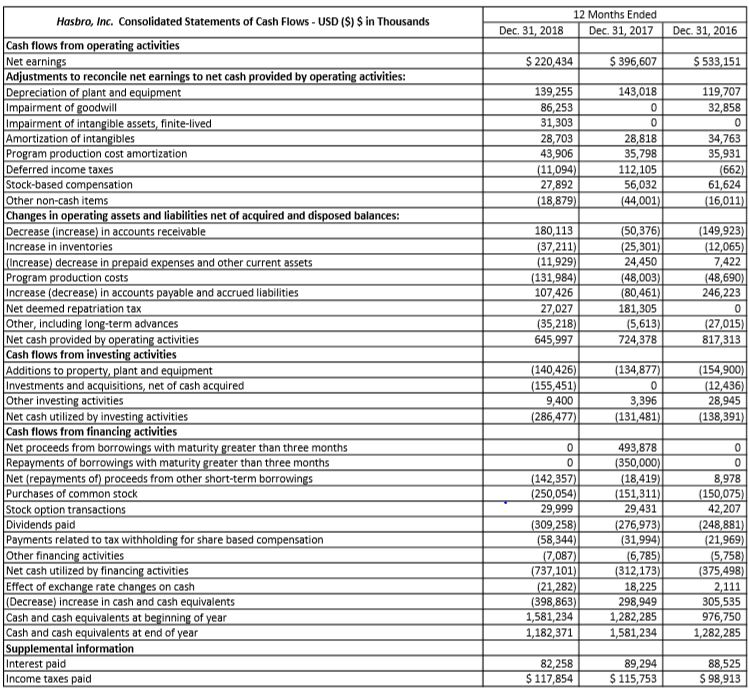
Dec 31, 2018 Dec 31, 2017 Hasbro, Inc. Consolidated Balance Sheets - USD ($) $ in Thousands Current assets Cash and cash equivalents $1,182,371 $1,581,234 Accounts receivable, less allowance for doubtful accounts of $9,100 in 2018 and $31,400 in 2017 1,188,052 1,405,399 Inventories 443,383 433,293 Prepaid expenses and other current assets Total current assets 268,698 3,082,504 214,000 3,633,926 256,473 259,710 Property, plant and equipment, net Other assets | 485,881 744,288 1,924,011 5,262,988 573,063 217,382 605,902 1,396,347 5,289,983 Goodwill Other intangibles, net Other Total other assets Total assets Current liabilities Short-term borrowings Accounts payable Accrued liabilities Total current liabilities Long-term debt Other liabilities Total liabilities Shareholders' equity Preference stock of $2.50 par value. Authorized 5,000,000 shares: none issued Common stock of $0.50 par value. Authorized 600,000,000 shares; issued 209,694,630 shares in 2018 and 2017 9,740 333 521 931,063 1,274,324 1,695,092 539,086 3,508,502 154,957 348,476 748,264 1,251,697 1,693,609 514,720 3,460,026 1 104,847 104,847 Additional paid-in capital 1,275,059 1,050,605 Retained earnings Accumulated other comprehensive loss Treasury stock, at cost, 83,565,598 shares in 2018 and 85,244,923 shares in 2017 4,184,374 (294,514) (3,515,280) 4,260,222 (239,425) (3,346,292) Total shareholders' equity 1,754,486 1,829,957 Total liabilities, redeemable noncontrolling interests and shareholders' equity $5,262,988 $5,289,983 12 Months Ended Dec. 31, 2018 Dec. 31, 2017 $ 4,579,646 $5,209,782 mlangibles 1,850,678 351,660 246,165 439,922 28,703 43,906 1,287,560 4.248,594 331,052 2,033,693 405,488 269,020 501,813 28,818 35,798 1,124,793 4,399,423 810,359 Hasbro, Inc. Consolidated Statements of Operations - USD ($) $ in Thousands Consolidated Statements of Operations [Abstract] Net revenues, external Costs and expenses Cost of sales Royalties Product development Advertising Amortization of intangibles Program production cost amortization Selling, distribution and administration Total expenses Operating profit Non-operating (income) expense Interest Expense Interest income Other (income) expense, net Total non-operating expense, net Earnings before income taxes Income taxes Net earnings Net Loss Attributable to Noncontrolling Interests Net Earnings Attributable to Hasbro, Inc. Net earnings attributable to Hasbro, Inc. per common share: Basic (in dollars per share) Diluted (in dollars per share) Cash dividends declared (in dollars per share) 90,826 (22,357) (7,819) 60,650 270,402 49,968 220,434 98,268 (22,155) (51,904) 24,209 786,150 389,543 396,607 $ 220,434 $ 396,607 $ 1.75 1.74 $ 2.52 $ 3.17 3.12 $ 2.28 Hasbro, Inc. Consolidated Statements of Cash Flows - USD ($) $ in Thousands 12 Months Ended Dec 31, 2017 Dec 31, 2018 Dec 31, 2016 $ 220,434 $396,607 S 533,151 143,018 0 1 119,707 32,858 O 139,255 139,255 86,253 31,303 28,703 43,906 (11,094) 27,892 (18,879) 28,818 35,798 112,105 56,032 (44,001) 34,763 35,931 (662) 61,624 (16,011) 180,113 (37,211) (11,929) (131,984) 107,426 27,027 (35,218)| 645,997 (50,376) (25,301) 24,450 (48,003) (80,461) 181,305 (5,613) 724,378 (149,923) (12,065) 7,422 (48,690) 246,223 (27,015) 817,313 Cash flows from operating activities Net earnings Adjustments to reconcile net earnings to net cash provided by operating activities: Depreciation of plant and equipment Impairment of goodwill Impairment of intangible assets, finite-lived Amortization of intangibles Program production cost amortization Deferred income taxes Stock-based compensation Other non-cash items Changes in operating assets and liabilities net of acquired and disposed balances: Decrease (increase) in accounts receivable Increase in inventories (increase) decrease in prepaid expenses and other current assets Program production costs Increase (decrease) in accounts payable and accrued liabilities Net deemed repatriation tax Other, including long-term advances Net cash provided by operating activities Cash flows from investing activities Additions to property, plant and equipment Investments and acquisitions, net of cash acquired Other investing activities Net cash utilized by investing activities Cash flows from financing activities Net proceeds from borrowings with maturity greater than three months Repayments of borrowings with maturity greater than three months Net (repayments of) proceeds from other short-term borrowings Purchases of common stock Stock option transactions Dividends paid Payments related to tax withholding for share based compensation Other financing activities Net cash utilized by financing activities Effect of exchange rate changes on cash (Decrease) increase in cash and cash equivalents Cash and cash equivalents at beginning of year Cash and cash equivalents at end of year Supplemental information Interest paid Income taxes paid (134,877) 0 (140,426) (155,451) 9 ,400 (286,477)| 1 3,396 (131,481) (154,900) (12,436) 28,945 (138,391) 0 0 0 0 (142,357) (250,054) 29,999 (309,258) (58,344) (7,087) (737,101) (21,282) (398,863) 1,581,234 1,182,371 493,878 (350,000) (18,419) (151,311) 29,431 (276,973) (31,994) (6,785) (312,173) 18,225 8,978 (150,075) 42,207 (248,881) (21,969) (5,758) (375,498) 2,111 305,535 9 76,750 ,282,285 1,282,285 1,581,234 1 82,258 $ 117,854 89,294 $ 115,753 88,525 $ 98,913